1. Article purpose[edit | edit source]
This article provides useful information to start using Linux® tracing, monitoring and debugging environments.
Two entry points are proposed in this article:
- Linux tracing, monitoring and debugging tools, which gives an overview of some Linux® tools including usage and application domain. This chapter is useful when you already know the domain or the interface to search for.
- Trace and debug overview per Linux software frameworks, which points to articles explaining how to get trace and debug information about the Linux® software frameworks that are relevant for the STM32MPU Embedded Software. This chapter is useful when you know the Linux® framework to search for.
2. Linux trace architecture overview[edit | edit source]
The Linux® trace architecture can be organized into four levels as shown in the figure below (inspired by Brendan Gregg presentation[1]):

2.1. Back-end instrumentation[edit | edit source]
The back-end instrumentation provides tracing sources built in the Linux® kernel. They are split into three categories:
- tracepoints: kernel static tracing, statically placed at logical places in the kernel. It provides key event details as a "format" string.
- kprobes: kernel dynamic tracing. It allows to trace function calls, returns and line numbers.
- uprobes: dynamic user-level tracing.
2.2. Tracing framework[edit | edit source]
Also named tracers, they use tracing sources.
Tracing frameworks include kernel in-tree tracers such as ftrace and perf_events, and out-of-tree tracers such as SystemTap and sysdig.
2.3. Front-end tools[edit | edit source]
Front-end tools come on top of tracers and help to configure them. For example:
- trace-cmd or LTTng for ftrace
- perf or perf-Tools for perf_events
2.4. Add-on tools and viewer[edit | edit source]
Add-on tools are also on top of tracers. However, they are not embedded inside the Linux® kernel.
Viewer tools propose Visual interpretation of trace data. For example:
- kernelshark for ftrace/trace-cmd
- Trace Compass[2] for LTTng (and more)
- Flame Graph[3] for perf
3. Linux tracing, monitoring and debugging tools[edit | edit source]
Linux® provides many tools that are either dedicated to one function or multifunction (generic).
They cover both Linux® kernel and Linux® user space.
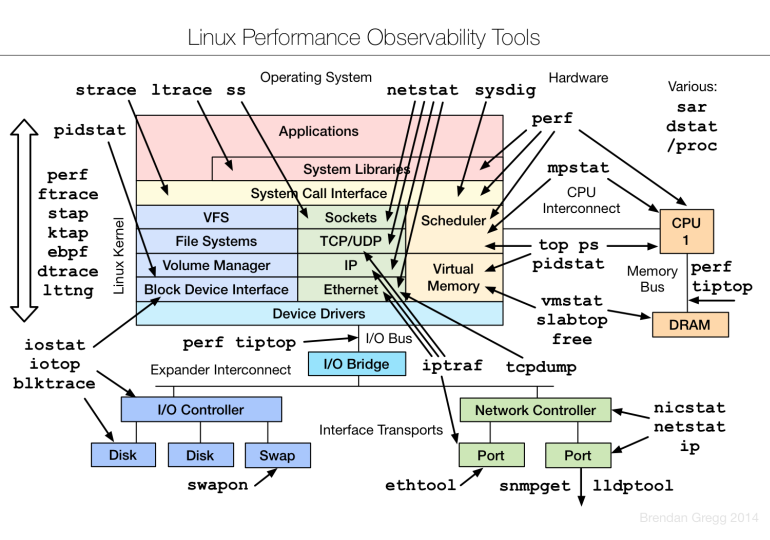
3.1. Domain mapping[edit | edit source]
The following mapping, done by Brendan Gregg [4], shows the different existing tools associated to the different Linux® frameworks.
3.2. Tool overview[edit | edit source]
The following table provides a brief description of the tool, as well as its availability depending on the software packages:
![]() : this tool is either present (ready to use or to be activated), or can be integrated and activated on the software package.
: this tool is either present (ready to use or to be activated), or can be integrated and activated on the software package.
![]() : this tool is not present and cannot be integrated, or it is present but cannot be activated on the software package.
: this tool is not present and cannot be integrated, or it is present but cannot be activated on the software package.
| Tool | STM32MPU Embedded Software distribution | STM32MPU Embedded Software distribution for Android™ | ||||||
|---|---|---|---|---|---|---|---|---|
| Name | Category | Purpose | Starter Package | Developer Package | Distribution Package | Starter Package | Developer Package | Distribution Package |
| blktrace | Tracing tools | blktrace[5] generates traces of the I/O traffic on block devices (SD card, USB, eMMC...) | ||||||
| systemd core dump | Debugging tools | systemd core dump: generates core dump files on Linux |
||||||
| ethtool | Monitoring tools | ethtool[6] allows to query or control network driver and hardware settings, in particular for wired Ethernet devices. | ||||||
| ftrace | Tracing tools | ftrace[7] (Function Tracer) is a powerful kernel tracing utility that is able, for instance, to trace every kernel function calls and kernel events without adding any extra code in your kernel source code | ||||||
| GDB | Debugging tools | The GNU Project debugger, GDB[8], allows monitoring program execution, or what the program was doing at the moment it crashed. |
||||||
| * Cross compile gdb and openocd binaries are required and only available from Developer Package. ** It is recommended to use the Developer Package to run the gdb debug session, which provided all dependencies |
||||||||
| ifconfig | Monitoring tools | ifconfig[9] is a system administration utility for network interface configuration. ifconfig is deprecated and has been replaced by ip (A web page provides a comparison between ifconfig and ip [10]) |
||||||
| ip | Monitoring tools | ip[11] shows / manipulates routing, devices, policy routing and tunnels of network interfaces. ip replaces the deprecated command ifconfig |
||||||
| kmemleak | Monitoring tools | kmemleak[12] provides a means to detect possible kernel memory leaks in a similar way to a tracing garbage collector, with the difference that the orphan objects are not freed, but only reported via /sys/kernel/debug/kmemleak. | ||||||
| trace-cmd | Tracing tools | trace-cmd[13] command interacts with the Ftrace tracer that is built inside the Linux kernel. It interfaces with the Ftrace specific files found in the debugfs file system under the tracing directory. kernelshark[14] is a front-end reader of trace-cmd output. "trace-cmd record" and "trace-cmd extract" create a trace.dat (trace-cmd.dat) file. kernelshark can read this file, and produce a graph and list view of the corresponding data. |
||||||
| ltrace | Tracing tools | ltrace[15] is used to display the calls to shared libraries made by a userspace application. ltrace is a userspace application. Its use is very similar to strace. |
||||||
| LTTng | Tracing tools | LTTng[16] is an open source tracing framework for Linux kernel and user spaces. It is a powerful tool that can be used for many purposes. LTTng traces need to be processed/displayed with a host tool such as Trace Compass[17], based on Eclipse plugin for increased portability. | ||||||
| netdata | Monitoring tools | netdata[18] is a system for distributed real-time performance and health monitoring. It provides unparalleled insights, in real-time, of everything happening on the system it runs (including applications such as web and database servers), using modern interactive web dashboards. | ||||||
| netstat | Monitoring tools | netstat[19] prints network connections, routing tables, interface statistics, masquerade connections, and multicast membership information. | ||||||
| perf | Monitoring tools | perf[20] is a Linux user space tool, which allows getting system performance figures | ||||||
| Note: simpleperf[21] is present as equivalent but with less options | ||||||||
| strace | Tracing tools | strace[22] is able to intercept and record the system calls which are called by a process and the signals which are received by another process. | ||||||
| sysdig | Monitoring tools | sysdig[23] is a tool for system troubleshooting, analysis and exploration. It can be used to capture, filter and decode system calls and other OS events. | ||||||
| sysprof | Monitoring tools | sysprof[24] is a statistical, system-wide profiler for Linux. It helps in finding the functions in which a program spends most of its time. sysprof proposes a user interface available directly on the board display screen. |
||||||
| sysstat | Monitoring tools | The sysstat [25] tool suite contains utilities to monitor the system performance and usage activity. It contains various utilities, common to many commercial Unix distributions, as well as tools that can be scheduled (via a scheduler such as cron) to collect and historize performance and activity data:
|
||||||
| tcpdump | Monitoring tools | tcpdump[26] is a common packet analyzer that runs under the command line. It allows the user to display TCP/IP and other packets being transmitted or received over a network to which the computer is connected. | ||||||
| top | Monitoring tools | The top[27] program provides a dynamic real-time view of a running system. It can display system summary information as well as a list of tasks currently being managed by the Linux kernel. The types of system summary information shown and the types, order and size of information displayed for tasks are all user configurable and that configuration can be made persistent across restarts. (Extracted from man page[27]) | ||||||
| valgrind | Monitoring tools | valgrind[28] is an instrumentation framework for building dynamic analysis tools. Some Valgrind tools can automatically detect many memory management and threading bugs, and profile your programs in detail. This is tool for Linux application analysis. |
||||||
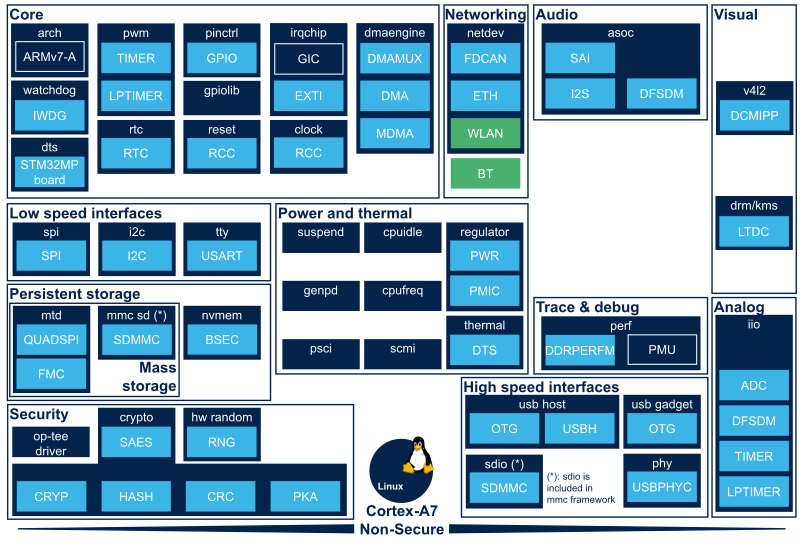
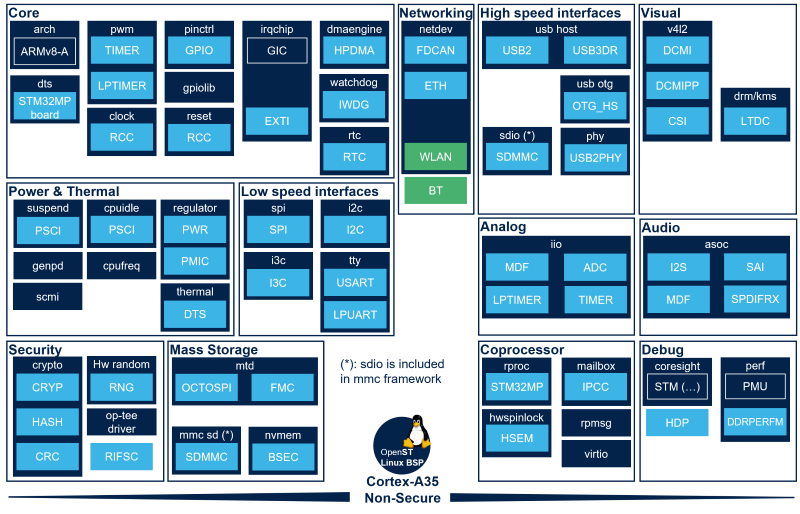
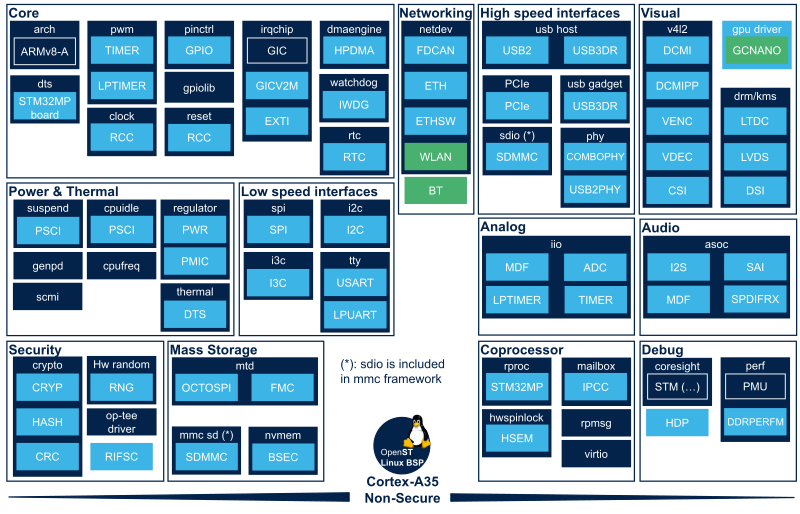
4. Trace and debug overview per Linux software frameworks[edit | edit source]
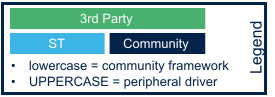
The pictures below allow accessing to different Linux software frameworks which provide specific trace and debug information in their "How to trace and debug the framework" dedicated chapter.
4.1. On STM32MP13x lines  [edit | edit source]
4.2. On STM32MP15x lines [edit | edit source]
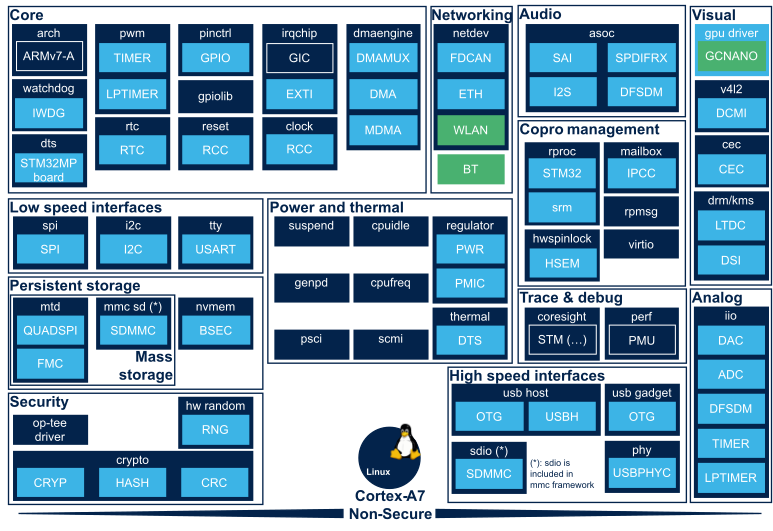
4.3. On STM32MP21x lines [edit | edit source]
4.4. On STM32MP23x lines [edit | edit source]
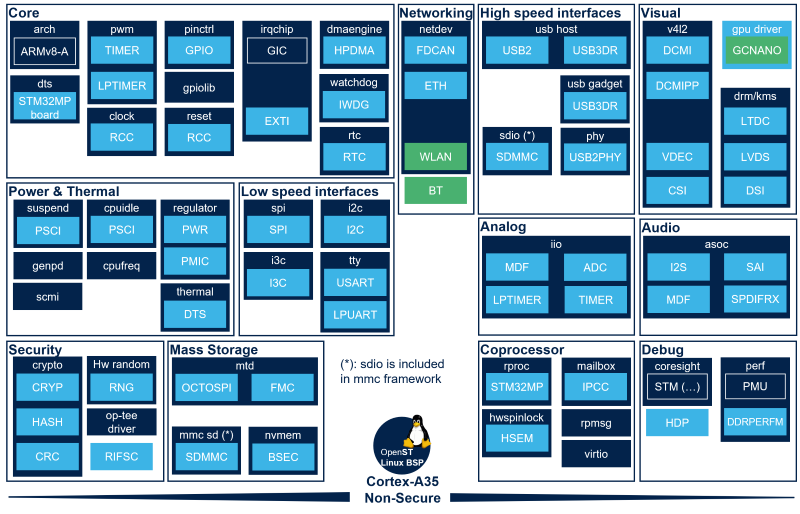
4.5. On STM32MP25x lines [edit | edit source]
5. Tips[edit | edit source]
How to find Linux kernel driver associated to a device.
How to use the kernel dynamic debug.
6. Documentation and web articles[edit | edit source]
A lot of articles on the web mention Linux® kernel tracing and profiling. The following links provide a good introduction to these topics:
- Linux Performance Analysis - New Tools and Old Secrets: description of the Linux® technology and of the different tools available.
- Yocto project: Tracing and profiling: How to enable tracing and profiling tools using Yocto
- Brendan Gregg Linux performance page
| More general Linux performance information are available in nice slideshare presentation (Brendan Gregg), on the Brendan Gregg official web site or in LinuxCon2014 article. |
Reference list:
- ↑ http://www.brendangregg.com/linuxperf.html
- ↑ https://www.eclipse.org/tracecompass
- ↑ http://www.brendangregg.com/flamegraphs.html
- ↑ http://www.brendangregg.com/linuxperf.html
- ↑ https://linux.die.net/man/8/blktrace
- ↑ https://linux.die.net/man/8/ethtool
- ↑ https://elinux.org/Ftrace
- ↑ https://www.gnu.org/software/gdb
- ↑ https://linux.die.net/man/8/ifconfig
- ↑ https://tty1.net/blog/2010/ifconfig-ip-comparison_en.html
- ↑ https://linux.die.net/man/8/ip
- ↑ http://www.procode.org/kmemleak/
- ↑ https://lwn.net/Articles/410200/
- ↑ https://kernelshark.org/
- ↑ https://www.ltrace.org/
- ↑ http://lttng.org
- ↑ https://www.eclipse.org/tracecompass
- ↑ https://www.netdata.cloud/
- ↑ https://linux.die.net/man/8/netstat
- ↑ https://perf.wiki.kernel.org/index.php/Main_Page
- ↑ https://source.android.com/devices/tech/debug/eval_perf
- ↑ https://strace.io/
- ↑ https://sysdig.com
- ↑ http://www.sysprof.com/
- ↑ https://sysstat.github.io/
- ↑ http://www.tcpdump.org/
- ↑ 27.0 27.1 http://linux.die.net/man/1/top
- ↑ http://valgrind.org/
- ↑ Use AddressSanitizer (ASan) for Android: https://source.android.com/devices/tech/debug/asan