1. Article purpose[edit | edit source]
This article provides the basic information needed to start using the GDB[1] application tool.
It explains how to use this GNU debugger tool connected to your ST board target via Ethernet or via ST-LINK, and how to perform cross-debugging (IDE, gdb viewer tool or command line) on Arm® Cortex®-A side for Linux® application, Linux® kernel (including external modules), or Arm® Cortex®-M firmware.
2. Introduction[edit | edit source]
The following table provides a brief description of the tool, as well as its availability depending on the software packages:
![]() : this tool is either present (ready to use or to be activated), or can be integrated and activated on the software package.
: this tool is either present (ready to use or to be activated), or can be integrated and activated on the software package.
![]() : this tool is not present and cannot be integrated, or it is present but cannot be activated on the software package.
: this tool is not present and cannot be integrated, or it is present but cannot be activated on the software package.
| Tool | STM32MPU Embedded Software distribution | STM32MPU Embedded Software distribution for Android™ | ||||||
|---|---|---|---|---|---|---|---|---|
| Name | Category | Purpose | Starter Package | Developer Package | Distribution Package | Starter Package | Developer Package | Distribution Package |
| GDB | Debugging tools | The GNU Project debugger, GDB[1], allows monitoring program execution, or what the program was doing at the moment it crashed. |
||||||
| * Cross compile gdb and openocd binaries are required and only available from Developer Package. ** It is recommended to use the Developer Package to run the gdb debug session, which provided all dependencies |
||||||||
The GDB can perform four main types of actions (plus other corollary actions) to help you detect bugs when running your software or application:
- Start the program, specifying anything that might affect its behaviour.
- Make the program stop on specific conditions.
- Examine what happened when the program stopped.
- Update the program in order to test a bug correction, and jump to the next one.
3. Overview of GDB setup for STM32MPU[edit | edit source]
3.1. GDB setup paths[edit | edit source]
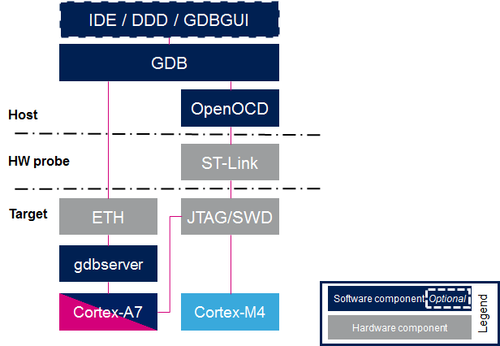
Two paths can be used in the STM32MPU environment for GDB setup:
- gdb ↔ gdbserver path through Ethernet, used for Cortex-A Linux applications.
- In that case, two software components are required, one on the target and the other on the host PC.
- gdb ↔ JTAG/SWD path through OpenOCD and ST-LINK, used both for Cortex-M firmware and Cortex-A OpenSTLinux BSP components (TF-A, OP-TEE, U-Boot and Linux kernel).
- In that case, only one software component is required on the host PC.
Two components are included in OpenSTLinux Developer Package for GDB setup:
- gdbserver: embedded on target rootfs and used as remote access for a host connection
- arm-ostl-linux-gnueabi-gdb: embedded on host PC side, cross-compiled gdb binary that manages the connexion between the host computer and the 32 bits target board
- aarch64-ostl-linux-gdb: embedded on host PC side, cross-compiled gdb binary that manages the connexion between the host computer and either the 32 bits or 64 bits target board
3.2. JTAG and SWD debug port[edit | edit source]
The STM32MPU features two debug ports through the embedded CoreSight™ component that implements an external access port for connecting debugging equipment:
- A 5-pin standard JTAG interface (JTAG-DP)
- A 2-pin (clock + data) “serial-wire debug” port (SW-DP)
These two modes are mutually exclusive since they share the same I/O pins.
Refer to STM32MPU reference manuals for information related to JTAG and SWD.
4. Installing the GDB tool[edit | edit source]
This tool is made of two parts, one on the host PC, and a second on the target (only for debugging Linux applications).
4.1. Installing the GDB tool on your host PC[edit | edit source]
Below is the list of required components:
- The cross-compiled GDB binary
- The OpenOCD binary and configuration files
- The symbols files of all BSP components (TF-A, OP-TEE, U-Boot and Linux kernel), corresponding to the images of the OpenSTLinux Starter Package.
4.1.1. Using the STM32MPU Embedded Software distribution[edit | edit source]
4.1.1.1. Developer Package[edit | edit source]
Only the Developer Package can be used, since it is the only one which provides all the required components.
4.2. Installing the GDB on your target board[edit | edit source]
On the target board, only the gdbserver binary is required for debugging Linux applications.
It is available by default within the Starter Package, which provides images linked to the Developer Package.
5. Getting started[edit | edit source]
This chapter describes the two ways for debugging OpenSTLinux BSP components (TF-A, OP-TEE, U-Boot and Linux kernel including external modules), Linux applications and Cortex-M firmware: by using GDB commands or by using a GDB user interface such as gdbgui, DDD or IDE.
5.1. Prerequisites[edit | edit source]
The target board is up and running.
5.2. Debug OpenSTLinux BSP components[edit | edit source]
5.2.1. Setting up GDB / OpenOCD debug path environment[edit | edit source]
- Architecture
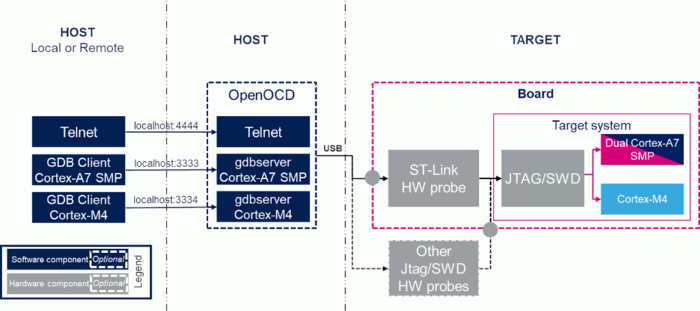
The figure below shows the architecture corresponding to the GDB/OpenOCD connected to Cortex-A and Cortex-M cores.
Note: The ST-LINK probes available on the STM32MPU boards can be used through a USB interface, as well as any other external probes through the Trace or JTAG connector.
- Prerequisites
- The Developer Package must be installed. It provides the SDK, the debug symbol files and the source files for TF-A, OP-TEE, U-Boot and Linux kernel (refer to STM32MPU Developer Package).
- The debug symbol files contain the symbols for the TF-A, OP-TEE, U-Boot and Linux kernel binaries (from the Starter Package image) that have been flashed on the board.
- Environment configuration files
- To speed up environment setup for debugging with GDB, download two configuration files, and install them on your PC (under the home directory: $HOME/gdbscripts/). You can then customize them:
- - Setup.gdb : main configuration file in which you can define the debug context you want to use (Refer to Boot chain overview for details).
Debug mode (1)
Cortex-A
TF-A(BL2)(2)
Cortex-A
OP-TEE(3)
Cortex-A
SSBL(U-Boot)(4)
Cortex-A
Linux kernel(0) - Boot 
(1) - Running target 
- - Path_env.py : customization file to define all the paths to source and symbol files, which can either be directly retrieved from the Developer Package (refer to the Example of directory structure for Packages), or result from a new compilation. In both cases, update the paths corresponding to your environment.
Please read carefully the comments provided in this file to help you updating source and symbol paths.
- - Path_env.py : customization file to define all the paths to source and symbol files, which can either be directly retrieved from the Developer Package (refer to the Example of directory structure for Packages), or result from a new compilation. In both cases, update the paths corresponding to your environment.
- Store these files locally on your host PC, check for name cast (Setup.gdb and Path_env.py) and update them accordingly.
5.2.2. Configuring GDB and OpenOCD for attachment on a running target[edit | edit source]
When the target board is running, you can attach the GDB only during one of following phases:
5.2.2.1. U-Boot execution phase[edit | edit source]
Select the right configuration in Setup.gdb:
# Set debug phase:
#       1: Attach at TF-A BL2
#       2: Attach at OP-TEE BL32
#       3: Attach at SSBL (U-Boot)
#       4: Attach at Linux kernel
set $debug_phase = 3
#	0: Attach at boot (requires "stm32wrapper4dbg")
#	1: Attach running target
set $debug_mode = 1
When the configuration is complete, jump to Running OpenOCD and GDB.
5.2.2.2. Linux kernel execution phase[edit | edit source]
Select the right configuration in Setup.gdb:
# Set debug phase:
#       1: Attach at TF-A BL2
#       2: Attach at OP-TEE BL32
#       3: Attach at SSBL (U-Boot)
#       4: Attach at Linux kernel
set $debug_phase = 4
#	0: Attach at boot (requires "stm32wrapper4dbg")
#	1: Attach running target
set $debug_mode = 1
When the configuration is complete, jump to Running OpenOCD and GDB.
5.2.3. Configuring GDB and OpenOCD for attachment on boot[edit | edit source]
You can attach the GDB during target boot only in the following cases:
- TF-A (BL2) boot case;
- OP-TEE (BL-32) boot case;
- U-Boot boot case;
- Linux kernel boot case.
To handle the cases above, the FSBL image has to be wrapped through the tool stm32wrapper4dbg. This operation allows the debugger to halt the target at the very first instruction of FSBL.
5.2.3.1. TF-A(BL2) boot case[edit | edit source]
In that case, the GDB breaks in bl2_entrypoint function.
Select the right configuration in Setup.gdb:
# Set debug phase:
#       1: Attach at TF-A BL2
#       2: Attach at OP-TEE BL32
#       3: Attach at SSBL (U-Boot)
#       4: Attach at Linux kernel
set $debug_phase = 1
#	0: Attach at boot (requires "stm32wrapper4dbg")
#	1: Attach running target
set $debug_mode = 0
When this operation is complete, jump to Running OpenOCD and GDB.
5.2.3.2. OP-TEE boot case[edit | edit source]
In that case, the GDB breaks in _start function.
Select the right configuration in Setup.gdb:
# Set debug phase:
#       1: Attach at TF-A BL2
#       2: Attach at OP-TEE BL32
#       3: Attach at SSBL (U-Boot)
#       4: Attach at Linux kernel
set $debug_phase = 2
#	0: Attach at boot (requires "stm32wrapper4dbg")
#	1: Attach running target
set $debug_mode = 0
When this operation is complete, jump to Running OpenOCD and GDB.
5.2.3.3. U-Boot boot case[edit | edit source]
In that case, the GDB breaks in in _start function.
Select the right configuration in Setup.gdb:
# Set debug phase:
#       1: Attach at TF-A BL2
#       2: Attach at OP-TEE BL32
#       3: Attach at SSBL (U-Boot)
#       4: Attach at Linux kernel
set $debug_phase = 3
#	0: Attach at boot (requires "stm32wrapper4dbg")
#	1: Attach running target
set $debug_mode = 0
When this operation is complete, jump to Running OpenOCD and GDB.
5.2.3.4. Linux kernel boot case[edit | edit source]
In that case, the GDB breaks in stext function.
Select the right configuration in Setup.gdb:
# Set debug phase:
#       1: Attach at TF-A BL2
#       2: Attach at OP-TEE BL32
#       3: Attach at SSBL (U-Boot)
#       4: Attach at Linux kernel
set $debug_phase = 4
#	0: Attach at boot (requires "stm32wrapper4dbg")
#	1: Attach running target
set $debug_mode = 0
When this operation is complete, jump to Running OpenOCD and GDB.
5.2.4. Running OpenOCD and GDB[edit | edit source]
- Prerequisites
Before running OpenOCD and GDB, check that the target board is in the right state.
For all configurations except GDB attachment to a running SSBL (U-Boot), the board has to operate in OpenSTLinux running mode.
In case of attachment to a running SSBL (U-Boot) configuration, the board target must be in U-Boot console mode:
#Reboot the target board

#Press any key to stop at U-Boot execution when booting the board
...
Hit any key to stop autoboot:  0
When you are in the expected configuration, two different consoles must be started:one for OpenOCD and one for GDB.
The SDK environment must be installed on both console terminals.
- OpenOCD console
OpenSTLinux provides the OpenOCD board configuration files for all the STM32 MPU boards supported. For other boards, check Running OpenOCD with custom boards.
# First console for starting openocd with configuration file
source <Your_SDK_path>/environment-setup-cortexa7t2hf-neon-vfpv4-ostl-linux-gnueabi
openocd -f <board.cfg>
- Possible target configuration files for <board.cfg>:
Target board board.cfg STM32MP135F-DK board/stm32mp13x_dk.cfg STM32MP157X-DK1 board/stm32mp15x_dk2.cfg STM32MP157X-DK2 board/stm32mp15x_dk2.cfg STM32MP157X-EV1 board/stm32mp15x_dk2.cfg STM32MP215X-DK board/stm32mp21x_dk_with_stlink.cfg STM32MP235X-DK board/stm32mp23x_dk.cfg STM32MP257X-DK board/stm32mp25x_dk.cfg STM32MP257X-EV1 board/stm32mp25x_dk.cfg
- GDB console
# Second console for starting the GDB
cd $HOME/gdbscripts/
source <Your_SDK_path>/environment-setup-cortexa7t2hf-neon-vfpv4-ostl-linux-gnueabi
$GDB -x Setup.gdb
5.2.5. Running OpenOCD with custom boards[edit | edit source]
While OpenSTLinux provides the OpenOCD board files for the supported STM32 MPU boards, OpenOCD command line can easily address custom boards, or adapters other than ST-Link or JTAG transport instead of SWD.
Each OpenOCD board file contains four main items:
- the adapter to use
- specify the configuration file of the adapter, e.g. interface/stlink-dap.cfg for ST-Link, interface/jlink.cfg for JLink, interface/cmsis-dap.cfg for all the adapters compatible with ARM CMSIS-DAP like ULink2;
- the transport protocol (SWD or JTAG);
- use the command "adapter transport <transport_name>", where <transport_name> is either dapdirect_swd or dapdirect_jtag for ST-Link, or swd or jtag for the other adapters;
- please notice that, at same clock speed, SWD is slightly faster than JTAG;
- the target device to debug;
- specify the configuration file of the target device, e.g. target/stm32mp13x.cfg;
- the reset pin connections between adapter and target
- use the command "reset_config <reset_options>", where <reset_options> is either none for no reset connections, or srst_only if only NRST pin is connected, or trst_and_srst for JTAG connection when both TRST and NRST are connected.
These items can either be listed in a custom configuration file or can be provided on the command line:
openocd -f <adapter.cfg> -c "adapter transport <transport_name>" -f <target.cfg> -c "reset_config <reset_options>"
Please check OpenOCD user manual [2] for detailed commands description.
5.2.6. To know more about Linux kernel debug with GDB[edit | edit source]
Please refer to Debugging the Linux kernel using the GDB.
5.2.7. Access to STM32MP registers[edit | edit source]
5.2.7.1. Using gdb command line[edit | edit source]
- The following monitoring commands can be used to read a register value:
monitor mdb <phys_address> [count] #Display target memory as 8-bit bytes
monitor mdh <phys_address> [count] #Display target memory as 16-bit bytes
monitor mdw <phys_address> [count] #Display target memory as 32-bit bytes
- For example: Read RCC_MP_APB1ENSETR register on STM32MP1 to check RCC APB1 peripheral enable status.
monitor mdw phys 0x50000a00 #full 32bits value result requested
0x50000a00: 00010000 --> UART4 is enable as explained in STM32MP15 reference manuals
- The following monitoring commands can be used to set a register value:
monitor mwb <phys_address> <value> [count] #Write byte(s) to target memory
monitor mwh <phys_address> <value> [count] #Write 16-bit half-word(s) to target memory
monitor mww <phys_address> <value> [count] #Write 32-bit word(s) to target memory
- For example: Write RCC_MP_APB1ENCLRR register on STM32MP1 to clear the UART4 RCC of APB1 peripheral, then reenable it:
monitor mww phys 0x50000a04 0x00010000 #full 32bits value given

# You can then check that UART4 is disable by reading the RCC_MP_APB1ENSETR register:
monitor mdw phys 0x50000a00
0x50000a00: 00000000

# You can also check that the console is disabled by going on running the GDB
c

# When the GBD has stopped running, you can re-enable UART4 RCC:
monitor mww phys 0x50000a00 0x00010000
5.2.7.2. Using CMSIS-SVD environment[edit | edit source]
The CMSIS-SVD environment is useful to get detailed information on registers, such as name and bit descriptions.
It is based on python scripts and svd files which contain the description of all registers.
Refer to CMSIS-SVD environment and scripts for more details.
5.3. Debug Cortex-M firmware with GDB[edit | edit source]
The Arm Cortex-M core firmware can also be debugged using the GDB in command line (without IDE).
Either developer boot mode and production boot mode are supported.
Please refer to the Hardware Description (Category:STM32 MPU boards) of your board for information on the Boot mode selection switch.
5.3.1. Debug Cortex-M firmware in developer boot mode[edit | edit source]
As in previous chapter Running OpenOCD and GDB, both OpenOCD and GDB have to be started on separate consoles.
OpenOCD has to be executed in the same way as in the mentionned chapter.
GDB, instead, has to be executed with a different command line, without the script but with the path of ELF file containing the firmware to be debugged:
# Second console for starting the GDB
source <Your_SDK_path>/environment-setup-cortexa7t2hf-neon-vfpv4-ostl-linux-gnueabi
$GDB $HOME/path/to/file.elf
Then, the following commands has to be typed in the GDB console to start the execution of a firmware and halt it at the beginning of main():
target extended-remote localhost:3334
load
thbreak main
continue
Once the execution halts at main(), GDB will return the prompt allowing the debug of the firmware.
5.3.2. Debug Cortex-M firmware in production boot mode[edit | edit source]
In production mode the firmware is started by Linux, independently from GDB. Nevertheless, GDB can set a breakpoint before the firmware is started by Linux; thus the firmware will halt at the breakpoint, allowing GDB to debug the firmware.
Please check in Linux remoteproc framework overview how to start and stop a firmware using Linux remoteproc framework.
At first, verify that no firmware is running on Cortex-M or, eventually, stop it.
Then, start OpenOCD and GDB as in previous chapter Debug Cortex-M firmware in developer boot mode.
Type the following commands in the GDB console:
target extended-remote localhost:3334
thbreak main
continue
Finally, let Linux start the firmware. The firmware execution will halt at main() and GDB will return the prompt allowing the debug of the firmware.
5.4. Debug Linux application with gdbserver[edit | edit source]
5.4.1. Enable debug information[edit | edit source]
Once your program is built using the sdk toolchain, make sure that the -g option is enabled to debug your program and add the necessary debug information.
Note: If an issue occurs during debugging, you can also force gcc to "not optimize code" using the -O0 option.
- Example of a simple test program build:
$CC -g -o myappli myappli.c
- Example based on Hello World: refer to "hello world" user space example
Edit and update the makefile for the user space example:
...
# Add / change option in CFLAGS if needed
-# CFLAGS += <new option>
+ CFLAGS += -g
...
5.4.2. Remote debugging using gdbserver[edit | edit source]
In this setup, an ethernet link must be set between the host PC and the target board.
Once your program is installed on the target (using ssh or copied from an SDcard), you can start debugging it.
- On target side: based on "Hello world" user space example
cd /usr/local/bin
ls
   hello_world_example
gdbserver <IP_Addr_of_Host>:1234 hello_world_example
  Process main created; pid = 11832 (this value depends on your target)
  Listening on port 1234
- Your target waits for remote PC connection, and then starts debugging.
- Launch the GDB command from your source file folder (easier source loading)
The SDK environment must be installed.
cd <source file folder path>
ls
    hello_world_example  hello_world_example.c  hello_world_example.o  kernel_install_dir  Makefile
source <Your_SDK_path>/environment-setup-cortexa7t2hf-neon-vfpv4-ostl-linux-gnueabi
$GDB
   GNU gdb (GDB) X.Y.Z
   ...
   This GDB was configured as "--host=x86_64-ostl_sdk-linux --target=arm-ostl-linux-gnueabi".
   ...
- Connect to the target and load the source file:
target remote <IP_Addr_of_Board>:1234
  Remote debugging using <IP_Addr_of_Board>:1234
  Reading /home/root/test from remote target...
  ...
break 16 (line number in the source file)
continue
- The target program breaks on the breakpoint. Proceed until the end of the program:
continue
  Continuing.
  [Inferior 1 (process 16204) exited normally]
quit
5.5. User interface application[edit | edit source]
5.5.1. Text user interface (TUI) mode[edit | edit source]
This user interface mode is the first step before using the graphical UI as GDBGUI or DDD.
The TUI can be very useful to map source code with instruction.
Please go through the online documentation [3] [4].
5.5.2. Debugging with GDBGUI[edit | edit source]
Please refer to the dedicated gdbgui article.
5.5.3. Debugging with DDD[edit | edit source]
GNU DDD is a graphical front-end for command-line debuggers. Please refer to dedicated web page for details[5].
5.5.4. Debugging with IDE[edit | edit source]
Please refer to STM32CubeIDE.
6. Security on JTAG DAP and on Debug[edit | edit source]
6.1. DEBUG Access Port (DAP) control summary[edit | edit source]
DAP security is controlled through the OTP security word:
- OTP word 0 on STM32MP1xx device (STM32MP13 and STM32MP15)
- OTP word 1 on STM32MP2xx device (STM32MP21 and STM32MP23/STM32MP25)
It applies ONLY to securable device allowing secure boot (STM32MPxxxC/F device).
For non-securable device (STM32MPxxA/D device) the OTP security word should NEVER be programmed, in that case the debug access control is done directly through the BSEC_DENABLE register.
6.1.1. STM32MP15xC/F series[edit | edit source]
JTAG DAP port is enabled on secured unlocked device and on secured locked device
6.1.2. STM32MP135xC/F series[edit | edit source]
On secured unlocked device, JTAG port is enabled
On secured locked device, referring to the STM32MP13_OTP_mapping, the OTP word 0 is used as follow:
OTP word 0: 0x3F JTAG debug port is enabled
OTP word 0: 0x17F JTAG debug port enabled, BSCAN disabled
OTP word 0: 0x3FF JTAG debug port is disabled , write access to JTAG registers is disabled
6.2. Debug control summary (at ROM code exit)[edit | edit source]
The control of the security of the debug is done with BSEC_DENABLE register located in BSEC peripheral that has the priority over OTP#0 but need JTAG DAP opened.
6.2.1. STM32MP15xC/F series[edit | edit source]
On secured unlocked device, secure and non-secure debug are enabled by default.
On secured locked device, secure and non-secure debug are disabled.
6.2.2. STM32MP135xC/F series[edit | edit source]
- Normal boot (flashes, serial) mode
Secure and non-secure debug are not enabled (need a wrapper to debug SW in Trust-Zone Secure to enable secure and non-secure debug, see Wrapper_for_FSBL_images wiki page)
In case ROM code boot load issue: secure and non secure debug are enabled
- Developer boot mode
Secure and non-secure debug are enabled
- Normal boot mode debug is not enabled (As per STM32MP13 reference manuals §3.3.9 Debug control in "BSEC_DENABLE default values after reset" Table), no ROM code change
- Developer boot mode is not possible
On the JTAG disabled devices, the chip JTAG/Serial-wire debug port (SWJ-DP) is disabled. however, in this state JTDO, JTMS output paths are disabled but the JTDI still remains accessible for RMA password entry.
On secured locked devices (BSEC_OTP_DATA0[9:0] = “0000111111”), the debug can be re-enable by setting BSEC_DENABLE.
- In case of ROM code "boot failure", internal ROM code error, debug is disabled.
- in case RMA state, JTAG DAP is re-opened and secure and non-secure debug is re-enabled but Upper OTPs and swprlock3 OTP are no more accessible (More about RMA mode in AN5827 and life cycle wiki article).
6.2.3. STM32MP2xxC/F series[edit | edit source]
Parts are delivered as secured-open unlock state, there are no unsecured parts shipped out of fab.
- Normal boot (flashes, serial) mode: debug is not enabled (a wrapper is needed to debug SW in Trust-Zone Secure to enable debug, see Wrapper_for_FSBL_images wiki page).
- Developer boot mode: debug is enabled.
- Normal boot mode debug is not enabled authentication is mandatory, adding a wrapper for debug is no more possible.
- Developer boot mode is not possible.
- in case RMA state, JTAG DAP is re-opened and debug is re-enabled but Upper OTPs are no more accessible.
7. To go further[edit | edit source]
7.1. Useful GDB commands[edit | edit source]
When using the GDB in command line mode, it is important to know some basic GDB commands, such as run software, set breakpoints, execute step by step, print variables and display information.
Please refer to GDB commands article.
7.2. Core dump analysis using GDB[edit | edit source]
The core dump generated for an application crash can be analysed by using the GDB.
Developer Package components, such as SDK and symbol files, must installed. Please refer to STM32MPU Developer Package.
The symbol file containing the debug symbol of the application in which the crash occurred must also be available.
- First enable the SDK environment:
source <Your_SDK_path>/environment-setup-cortexa7t2hf-neon-vfpv4-ostl-linux-gnueabi
- Then play the core dump with GDB:
$GDB <path_to_the_binary> <path_to_the_core_dump_file>
7.3. Tips[edit | edit source]
- Managing multiple debug setups
To manage multiple debug setups for different software versions, create different Path_env.py files with different names, and call the expected file in the Setup.gdb file:
...
####################################################################

# Set environment configuration
#Path_env.py
source Path_env_dk2_18_12_14.py

####################################################################
...
8. References[edit | edit source]
- Useful external links
| Document link | Document Type | Description |
|---|---|---|
| Using kgdb, kdb and the kernel debugger internals | User Guide | KGDB documentation guide |
| Welcome to the GDB Wiki | User guide | GDB Wiki |
| Building GDB and GDBserver for cross debugging | User Guide | Explain how to build gdb for target and host |
| A GDB Tutorial with Examples | Training | Debugging a simple application |
Arm® is a registered trademark of Arm Limited (or its subsidiaries) in the US and/or elsewhere. ![]()
Arm® is a registered trademark of Arm Limited (or its subsidiaries) in the US and/or elsewhere. ![]()