1. Article purpose[edit | edit source]
This article provides the basic information needed to start using the sysstat[1] tool suite providing a collection of Linux tools:
- main tools: iostat, mpstat and pidstat
- others tools: sar, sadf
2. Introduction[edit | edit source]
The following table provides a brief description of the tool, as well as its availability depending on the software packages:
![]() : this tool is either present (ready to use or to be activated), or can be integrated and activated on the software package.
: this tool is either present (ready to use or to be activated), or can be integrated and activated on the software package.
![]() : this tool is not present and cannot be integrated, or it is present but cannot be activated on the software package.
: this tool is not present and cannot be integrated, or it is present but cannot be activated on the software package.
| Tool | STM32MPU Embedded Software distribution | STM32MPU Embedded Software distribution for Android™ | ||||||
|---|---|---|---|---|---|---|---|---|
| Name | Category | Purpose | Starter Package | Developer Package | Distribution Package | Starter Package | Developer Package | Distribution Package |
| sysstat | Monitoring tools | The sysstat [1] tool suite contains utilities to monitor the system performance and usage activity. It contains various utilities, common to many commercial Unix distributions, as well as tools that can be scheduled (via a scheduler such as cron) to collect and historize performance and activity data:
|
||||||
3. Installing the trace and debug tool on the target board[edit | edit source]
3.1. Using the STM32MPU Embedded Software distribution[edit | edit source]
The Sysstat tools are installed by default (/usr/bin/) and ready to be used with all STM32MPU OpenSTLinux Packages.
It is integrated in weston image distribution through meta-st package: meta-st/meta-st-openstlinux/recipes-st/packagegroups/packagegroup-framework-tools.bb.
RDEPENDS:packagegroup-framework-tools-core = "\
   grep            \
   ...
   e2fsprogs       \
   e2fsprogs-resize2fs \
   sysstat         \
   minicom         \
   ...
   "
4. Getting started[edit | edit source]
4.1. Using iostat[edit | edit source]
The iostat command is used for monitoring system input/output device loading by observing the time the devices are active in relation to their average transfer rates. The iostat command generates reports that can be used to change system configuration to better balance the input/output load between physical disks.[2]
/proc filesystem must be mounted for iostat to work. This is the case on STM32MPU Embedded Software.
- Command line options. Please refer to manual page[2] for details.
iostat --help
Usage: iostat [ options ] [ <interval> [ <count> ] ]
Options are:
[ -c ] [ -d ] [ -h ] [ -k | -m ] [ -N ] [ -s ] [ -t ] [ -V ] [ -x ] [ -y ] [ -z ]
[ { -f | +f } <directory> ] [ -j { ID | LABEL | PATH | UUID | ... } ]
[ --compact ] [ --dec={ 0 | 1 | 2 } ] [ --human ] [ --pretty ] [ -o JSON ]
[ [ -H ] -g <group_name> ] [ -p [ <device> [,...] | ALL ] ]
[ <device> [...] | ALL ]
- Basic command to display a single history since boot report for all CPU and devices:
iostat
Linux 4.14.48 (stm32mp1) 	06/18/18 	_armv7l_	(2 CPU)

avg-cpu:  %user   %nice %system %iowait  %steal   %idle
           0.11    0.00    0.60    0.05    0.00   99.25

Device             tps    kB_read/s    kB_wrtn/s    kB_read    kB_wrtn
mmcblk0           0.59         5.44         0.85      58539       9128
mmcblk1           0.03         0.31         0.00       3320          0
mmcblk1boot1      0.00         0.01         0.00        104          0
mmcblk1boot0      0.00         0.01         0.00        104          0
Note: by adding <interval> and <count> parameters, you can have a regular refresh during a given time interval:
iostat <interval> <count>
- Complex command to display statistics for block devices and all their partitions that are used by the system:
iostat -N -p ALL
Linux 4.14.48 (stm32mp1) 	06/18/18 	_armv7l_	(2 CPU)

avg-cpu:  %user   %nice %system %iowait  %steal   %idle
          0.11    0.00    0.61    0.05    0.00   99.23

Device             tps    kB_read/s    kB_wrtn/s    kB_read    kB_wrtn
ram0              0.00         0.00         0.00          0          0
ram1              0.00         0.00         0.00          0          0
ram2              0.00         0.00         0.00          0          0
ram3              0.00         0.00         0.00          0          0
ram4              0.00         0.00         0.00          0          0
ram5              0.00         0.00         0.00          0          0
ram6              0.00         0.00         0.00          0          0
ram7              0.00         0.00         0.00          0          0
ram8              0.00         0.00         0.00          0          0
ram9              0.00         0.00         0.00          0          0
ram10             0.00         0.00         0.00          0          0
ram11             0.00         0.00         0.00          0          0
ram12             0.00         0.00         0.00          0          0
ram13             0.00         0.00         0.00          0          0
ram14             0.00         0.00         0.00          0          0
ram15             0.00         0.00         0.00          0          0
loop0             0.00         0.00         0.00          0          0
loop1             0.00         0.00         0.00          0          0
loop2             0.00         0.00         0.00          0          0
loop3             0.00         0.00         0.00          0          0
loop4             0.00         0.00         0.00          0          0
loop5             0.00         0.00         0.00          0          0
loop6             0.00         0.00         0.00          0          0
loop7             0.00         0.00         0.00          0          0
mtdblock0         0.00         0.00         0.00          0          0
mtdblock1         0.00         0.00         0.00          0          0
mtdblock2         0.00         0.00         0.00          0          0
mtdblock3         0.00         0.00         0.00          0          0
mtdblock4         0.00         0.00         0.00          0          0
mtdblock5         0.00         0.00         0.00          0          0
mtdblock6         0.00         0.00         0.00          0          0
mtdblock7         0.00         0.00         0.00          0          0
mmcblk0           0.66         6.02         0.94      58539       9128
mmcblk0p1         0.00         0.04         0.00        344          0
mmcblk0p2         0.00         0.02         0.00        220          0
mmcblk0p3         0.00         0.01         0.00         72          0
mmcblk0p4         0.03         0.21         0.00       2065          1
mmcblk0p5         0.60         5.46         0.94      53175       9126
mmcblk0p6         0.02         0.21         0.00       2087          1
mmcblk1           0.04         0.34         0.00       3320          0
mmcblk1p1         0.00         0.01         0.00         64          0
mmcblk1p2         0.00         0.00         0.00         44          0
mmcblk1p3         0.00         0.00         0.00         44          0
mmcblk1p4         0.01         0.11         0.00       1032          0
mmcblk1p5         0.01         0.11         0.00       1032          0
mmcblk1boot1      0.00         0.01         0.00        104          0
mmcblk1boot0      0.00         0.01         0.00        104          0
4.2. Using mpstat[edit | edit source]
The mpstat command writes to standard output activities for each available processor, processor 0 being the first one.[3]
- Command line options. Please refer to manual page[3] for details.
mpstat --help
Usage: mpstat [ options ] [ <interval> [ <count> ] ]
Options are:
[ -A ] [ -H ] [ -n ] [ -T ] [ -u ] [ -V ]
[ -I { SUM | CPU | SCPU | ALL } ] [ -N { <node_list> | ALL } ]
[ --dec={ 0 | 1 | 2 } ] [ -o JSON ] [ -P { <cpu_list> | ALL } ]
- Basic command to display three reports of global statistics for all processors at one second intervals:
mpstat 1 3
Linux 4.14.48 (stm32mp1) 	06/18/18 	_armv7l_	(2 CPU)

15:45:26     CPU    %usr   %nice    %sys %iowait    %irq   %soft  %steal  %guest  %gnice   %idle
15:45:27     all    0.00    0.00    0.00    0.00    0.00    0.00    0.00    0.00    0.00  100.00
15:45:28     all    0.00    0.00    0.00    0.00    0.00    0.00    0.00    0.00    0.00  100.00
15:45:29     all    0.00    0.00    0.00    0.00    0.00    0.00    0.00    0.00    0.00  100.00
Average:     all    0.00    0.00    0.00    0.00    0.00    0.00    0.00    0.00    0.00  100.00
- Other command to display three reports of statistics for all processors at one second intervals:
mpstat -P ALL 1 3
Linux 4.14.48 (stm32mp1) 	06/18/18 	_armv7l_	(2 CPU)

15:48:32     CPU    %usr   %nice    %sys %iowait    %irq   %soft  %steal  %guest  %gnice   %idle
15:48:33     all    0.00    0.00    0.00    0.00    0.00    0.00    0.00    0.00    0.00  100.00
15:48:33       0    0.00    0.00    0.00    0.00    0.00    0.00    0.00    0.00    0.00  100.00
15:48:33       1    0.00    0.00    0.00    0.00    0.00    0.00    0.00    0.00    0.00  100.00

15:48:33     CPU    %usr   %nice    %sys %iowait    %irq   %soft  %steal  %guest  %gnice   %idle
15:48:34     all    0.00    0.00    0.50    0.00    0.00    0.00    0.00    0.00    0.00   99.50
15:48:34       0    0.00    0.00    0.00    0.00    0.00    0.00    0.00    0.00    0.00  100.00
15:48:34       1    0.00    0.00    0.99    0.00    0.00    0.00    0.00    0.00    0.00   99.01

15:48:34     CPU    %usr   %nice    %sys %iowait    %irq   %soft  %steal  %guest  %gnice   %idle
15:48:35     all    0.00    0.00    0.50    0.00    0.00    0.00    0.00    0.00    0.00   99.50
15:48:35       0    0.00    0.00    0.00    0.00    0.00    0.00    0.00    0.00    0.00  100.00
15:48:35       1    0.00    0.00    0.99    0.00    0.00    0.00    0.00    0.00    0.00   99.01

Average:     CPU    %usr   %nice    %sys %iowait    %irq   %soft  %steal  %guest  %gnice   %idle
Average:     all    0.00    0.00    0.33    0.00    0.00    0.00    0.00    0.00    0.00   99.67
Average:       0    0.00    0.00    0.00    0.00    0.00    0.00    0.00    0.00    0.00  100.00
Average:       1    0.00    0.00    0.66    0.00    0.00    0.00    0.00    0.00    0.00   99.34
4.3. Using pidstat[edit | edit source]
The pidstat command is used for monitoring individual tasks currently being managed by the Linux kernel.[4]
- Command line options. Please refer to manual page[4] for details.
pidstat --help
Usage: pidstat [ options ] [ <interval> [ <count> ] ] [ -e <program> <args> ]
Options are:
[ -d ] [ -H ] [ -h ] [ -I ] [ -l ] [ -R ] [ -r ] [ -s ] [ -t ] [ -U [ <username> ] ]
[ -u ] [ -V ] [ -v ] [ -w ] [ -C <command> ] [ -G <process_name> ]
[ -p { <pid> [,...] | SELF | ALL } ] [ -T { TASK | CHILD | ALL } ]
[ --dec={ 0 | 1 | 2 } ] [ --human ]
- Basic command to display CPU statistic for all tasks:
pidstat
Linux 4.14.48 (stm32mp1) 	06/18/18 	_armv7l_	(2 CPU)

15:58:48      UID       PID    %usr %system  %guest   %wait    %CPU   CPU  Command
15:58:48        0         1    0.03    0.12    0.00    0.05    0.14     0  systemd
15:58:48        0         2    0.00    0.00    0.00    0.00    0.00     1  kthreadd
15:58:48        0         7    0.00    0.01    0.00    0.01    0.01     0  ksoftirqd/0
15:58:48        0         8    0.04    0.00    0.00    0.02    0.04     1  rcu_preempt
15:58:48        0        15    0.00    0.01    0.00    0.00    0.01     1  ksoftirqd/1
15:58:48        0        18    0.00    0.00    0.00    0.00    0.00     1  kdevtmpfs
15:58:48        0        19    0.00    0.00    0.00    0.00    0.00     0  kworker/0:1
15:58:48        0        72    0.00    0.00    0.00    0.00    0.00     0  irq/82-mfx
15:58:48        0        77    0.00    0.06    0.00    0.01    0.06     1  mmcqd/0
15:58:48        0        83    0.00    0.00    0.00    0.00    0.00     0  mmcqd/1
15:58:48        0        85    0.00    0.00    0.00    0.00    0.00     0  mmcqd/1boot0
15:58:48        0        86    0.00    0.00    0.00    0.00    0.00     0  mmcqd/1boot1
15:58:48        0        91    0.00    0.63    0.00    0.00    0.63     0  kmemleak
15:58:48        0        93    0.00    0.00    0.00    0.00    0.00     0  kworker/0:3
15:58:48        0        95    0.00    0.01    0.00    0.00    0.01     1  irq/73-5a001000
15:58:48        0        98    0.00    0.00    0.00    0.00    0.00     0  kworker/0:1H
15:58:48        0        99    0.00    0.00    0.00    0.00    0.00     1  kworker/1:1H
15:58:48        0       100    0.00    0.00    0.00    0.00    0.00     0  jbd2/mmcblk0p5-
15:58:48        0       150    0.01    0.02    0.00    0.02    0.02     0  systemd-journal
15:58:48        0       189    0.01    0.01    0.00    0.03    0.01     1  systemd-udevd
15:58:48        0       201    0.00    0.00    0.00    0.00    0.00     0  kworker/u4:2
15:58:48      993       203    0.01    0.09    0.00    0.00    0.11     1  systemd-timesyn
15:58:48      998       273    0.09    0.04    0.00    0.02    0.14     0  avahi-daemon
15:58:48        0       276    0.00    0.00    0.00    0.00    0.00     1  systemd-logind
15:58:48        0       277    0.00    0.00    0.00    0.00    0.00     1  klogd
15:58:48      996       279    0.00    0.00    0.00    0.00    0.00     0  dbus-daemon
15:58:48        0       301    0.00    0.00    0.00    0.00    0.00     1  syslogd
15:58:48      992       312    0.00    0.00    0.00    0.00    0.00     1  systemd-network
15:58:48        0       314    0.00    0.00    0.00    0.00    0.00     0  weston-launch
15:58:48        0       319    0.01    0.01    0.00    0.00    0.01     1  weston
15:58:48      991       324    0.00    0.00    0.00    0.00    0.00     0  systemd-resolve
15:58:48        0       327    0.03    0.03    0.00    0.00    0.05     0  tcf-agent
15:58:48        0       332    0.00    0.00    0.00    0.00    0.00     1  login
15:58:48        0       333    0.00    0.00    0.00    0.00    0.00     0  agetty
15:58:48      997       334    0.00    0.00    0.00    0.00    0.00     1  named
15:58:48        0       340    0.00    0.00    0.00    0.00    0.00     0  weston-keyboard
15:58:48        0       342    0.01    0.00    0.00    0.00    0.01     0  weston-desktop-
15:58:48        0       345    0.00    0.01    0.00    0.00    0.01     1  systemd
15:58:48        0       350    0.00    0.00    0.00    0.00    0.00     0  sh
15:58:48        0       374    0.02    0.00    0.00    0.00    0.02     1  kworker/1:1
15:58:48        0       420    0.00    0.00    0.00    0.00    0.00     1  kworker/1:0
15:58:48        0       423    0.00    0.00    0.00    0.00    0.00     1  kworker/1:2
15:58:48        0       424    0.00    0.00    0.00    0.00    0.00     1  pidstat
- Basic command to display 3 reports of CPU statistics for every active task in the system at one second intervals.:
pidstat 1 3
Linux 4.14.48 (stm32mp1) 	06/18/18 	_armv7l_	(2 CPU)

15:59:56      UID       PID    %usr %system  %guest   %wait    %CPU   CPU  Command
15:59:57        0       426    3.67    4.59    0.00    0.00    8.26     1  pidstat

15:59:57      UID       PID    %usr %system  %guest   %wait    %CPU   CPU  Command
15:59:58        0       426    0.99    6.93    0.00    0.00    7.92     1  pidstat

15:59:58      UID       PID    %usr %system  %guest   %wait    %CPU   CPU  Command
15:59:59        0        15    0.00    0.99    0.00    0.00    0.99     1  ksoftirqd/1
15:59:59        0       426    1.98    5.94    0.00    0.99    7.92     1  pidstat

Average:      UID       PID    %usr %system  %guest   %wait    %CPU   CPU  Command
Average:        0        15    0.00    0.32    0.00    0.00    0.32     -  ksoftirqd/1
Average:        0       426    2.25    5.79    0.00    0.32    8.04     -  pidstat
- Basic command to report statistics for a specific process with all associated threads:
pidstat -t -p `pidof weston-launch`
Linux 4.14.48 (stm32mp1) 	06/18/18 	_armv7l_	(2 CPU)

16:00:59      UID      TGID       TID    %usr %system  %guest   %wait    %CPU   CPU  Command
16:00:59        0       314         -    0.00    0.00    0.00    0.00    0.00     0  weston-launch
16:00:59        0         -       314    0.00    0.00    0.00    0.00    0.00     0  |__weston-launch
4.4. Using sar[edit | edit source]
The sar command collects, reports, or saves system activity information.[5]
- Command line options. Please refer to manual page[5] for details.
sar --help
Usage: sar [ options ] [ <interval> [ <count> ] ]
Options are:
[ -A ] [ -B ] [ -b ] [ -C ] [ -D ] [ -d ] [ -F [ MOUNT ] ] [ -H ] [ -h ]
[ -p ] [ -r [ ALL ] ] [ -S ] [ -t ] [ -u [ ALL ] ] [ -V ]
[ -v ] [ -W ] [ -w ] [ -x ] [ -y ] [ -z ]
[ -I [ SUM | ALL ] ] [ -P { <cpu_list> | ALL } ]
[ -m { <keyword> [,...] | ALL } ] [ -n { <keyword> [,...] | ALL } ]
[ -q [ <keyword> [,...] | ALL ] ]
[ --dev=<dev_list> ] [ --fs=<fs_list> ] [ --iface=<iface_list> ] [ --int=<int_list> ]
[ --dec={ 0 | 1 | 2 } ] [ --help ] [ --human ] [ --pretty ] [ --sadc ]
[ -j { SID | ID | LABEL | PATH | UUID | ... } ]
[ -f [ <filename> ] | -o [ <filename> ] | -[0-9]+ ]
[ -i <interval> ] [ -s [ <start_time> ] ] [ -e [ <end_time> ] ]
Main used options for activity report:
| sar option | Description |
|---|---|
| -u | CPU utilization of ALL CPUs |
| -P | CPU utilization of individual CPU or core |
| -r | Statistics for memory utilization |
| -S | Statistics for swap space utilization |
| -b | Statistics for I/O and transfer rate |
| -F | Statistics for currently mounted filesystems |
| -d | Activities for individual Block Device I/O |
| -w | Activities for task creation and system switching |
| -q | Information about task run queue and load average |
| -n | Statistics for network activities |
| -B | Report paging statistics |
4.4.1. Interactive mode[edit | edit source]
Two modes for using sar:
- Interactive mode (detailed here): sar is launched by the user using a command line on the console
- Non-interactive mode (detailed in To go further chapter): sar is launched by a script (/usr/libexec/sa/sa1, which is part of sysstat tools suite) that can be managed by a scheduler daemon like cron[6]
Interactive mode is used as soon as [ <interval> [ <count> ] ] parameters are present, otherwise non-interactive mode is used. In interactive mode, the command is executed immediately by taking into account the values.
As example, for getting CPU utilization of ALL CPUs, 5 times every 3s:
sar -u 3 5
Linux 4.14.48 (stm32mp1) 	06/18/18 	_armv7l_	(2 CPU)

12:30:20        CPU     %user     %nice   %system   %iowait    %steal     %idle
12:30:23        all      0.00      0.00      0.50      0.00      0.00     99.50
12:30:26        all      0.00      0.00      0.50      0.00      0.00     99.50
12:30:29        all      0.17      0.00      0.17      0.00      0.00     99.67
12:30:32        all      0.66      0.00      2.49      0.00      0.00     96.84
12:30:35        all      0.33      0.00      3.16      0.00      0.00     96.51
Average:        all      0.23      0.00      1.36      0.00      0.00     98.41
-o <filename> can be used to store information into a file in binary format, which cat be later read with sadf.
4.5. Using sadf[edit | edit source]
The sadf command is used for displaying the contents of data files created by the sar command[7]: sar in interactive mode by using -o option, or file created in non-interactive mode in /var/log/sa/ directory.
- Command line options. Please refer to manual page[7] for details.
sadf --help
Usage: sadf [ options ] [ <interval> [ <count> ] ] [ <datafile> | -[0-9]+ ]
Options are:
[ -C ] [ -c | -d | -g | -j | -l | -p | -r | -x ] [ -H ] [ -h ] [ -T | -t | -U ] [ -V ]
[ -O <opts> [,...] ] [ -P { <cpu> [,...] | ALL } ]
[ --dev=<dev_list> ] [ --fs=<fs_list> ] [ --iface=<iface_list> ] [ --int=<int_list> ]
[ -s [ <start_time> ] ] [ -e [ <end_time> ] ]
[ -- <sar_options> ]
Main used format for activity report:
| sadf option | Description |
|---|---|
| -d | Print the contents of the data file in a format that can be easily ingested by a relational database system. The output consists of fields separated by a semicolon (i.e. MSExcel) |
| -g | From v11.3.1 Print the contents of the data file in SVG (Scalable Vector Graphics) format. Use the follwing syntax: sadf -g sar_datafile [ -- <sar_options> ] > output.svg |
| -j | Print the contents of the data file in JSON (JavaScript Object Notation) format |
| -t | Display timestamp in the original local time of the data file creator instead of UTC (Coordinated Universal Time) |
| -x | Print the contents of the data file in XML format |
5. To go further[edit | edit source]
5.1. Using sar non-interactive mode[edit | edit source]
In non-interactive mode a scheduler daemon is used to plan activity record.
Recommended environment is using cron[6] daemon and sysstat script /usr/libexec/sa/sa1 present when the tool suite is installed. Please refer to sa1 man page[8] for detail.
cron is not installed by default, and is part of cronie yocto package to be integrated:
- With the Distribution Package of the STM32MPU Embedded Software distribution (st-image-weston):
echo 'IMAGE_INSTALL += "cronie"' >> meta-st/meta-st-openstlinux/recipes-st/images/st-image-weston.bbappend
5.1. Format datas to be imported in MS-Excel[edit | edit source]
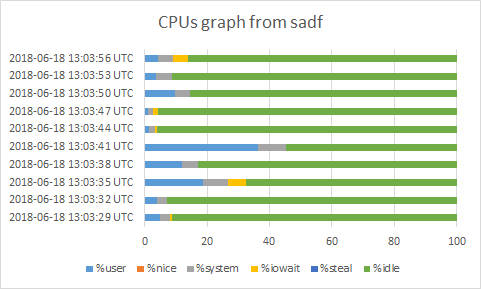
Example using sar command to get ALL CPUs usage, format datas into semicolumn text, then make a graph using MS-Excel:
- Record CPUs usage data (10 iterations every 3-second interval)
sar -u 3 10 -o test
Linux 4.14.48 (stm32mp1) 	06/18/18 	_armv7l_	(2 CPU)

13:03:26        CPU     %user     %nice   %system   %iowait    %steal     %idle
13:03:29        all      4.82      0.00      3.16      0.66      0.00     91.36
13:03:32        all      3.82      0.00      3.49      0.00      0.00     92.69
13:03:35        all     18.77      0.00      7.81      5.81      0.00     67.61
13:03:38        all     11.96      0.00      4.98      0.00      0.00     83.06
13:03:41        all     36.21      0.00      8.97      0.00      0.00     54.82
13:03:44        all      1.50      0.00      1.66      0.83      0.00     96.01
13:03:47        all      1.00      0.00      1.83      1.33      0.00     95.85
13:03:50        all      9.63      0.00      4.82      0.00      0.00     85.55
13:03:53        all      3.49      0.00      5.32      0.00      0.00     91.20
13:03:56        all      4.15      0.00      4.98      4.65      0.00     86.21
Average:        all      9.53      0.00      4.70      1.33      0.00     84.44
File test is also created (binary format).
- Create readable report format from test file, i.e. in semicolumn format, which can be imported in MSExcel graph:
sadf -d test > test.cvs
cat test.cvs
 # hostname;interval;timestamp;CPU;%user;%nice;%system;%iowait;%steal;%idle
 stm32mp1;3;2018-06-18 13:03:29 UTC;-1;4.82;0.00;3.16;0.66;0.00;91.36
 stm32mp1;3;2018-06-18 13:03:32 UTC;-1;3.82;0.00;3.49;0.00;0.00;92.69
 stm32mp1;3;2018-06-18 13:03:35 UTC;-1;18.77;0.00;7.81;5.81;0.00;67.61
 stm32mp1;3;2018-06-18 13:03:38 UTC;-1;11.96;0.00;4.98;0.00;0.00;83.06
 stm32mp1;3;2018-06-18 13:03:41 UTC;-1;36.21;0.00;8.97;0.00;0.00;54.82
 stm32mp1;3;2018-06-18 13:03:44 UTC;-1;1.50;0.00;1.66;0.83;0.00;96.01
 stm32mp1;3;2018-06-18 13:03:47 UTC;-1;1.00;0.00;1.83;1.33;0.00;95.85
 stm32mp1;3;2018-06-18 13:03:50 UTC;-1;9.63;0.00;4.82;0.00;0.00;85.55
 stm32mp1;3;2018-06-18 13:03:53 UTC;-1;3.49;0.00;5.32;0.00;0.00;91.20
 stm32mp1;3;2018-06-18 13:03:56 UTC;-1;4.15;0.00;4.98;4.65;0.00;86.21
6. References[edit | edit source]
- ↑ 1.0 1.1 https://sysstat.github.io/
- ↑ 2.0 2.1 https://man7.org/linux/man-pages/man1/iostat.1.html
- ↑ 3.0 3.1 https://man7.org/linux/man-pages/man1/mpstat.1.html
- ↑ 4.0 4.1 https://man7.org/linux/man-pages/man1/pidstat.1.html
- ↑ 5.0 5.1 https://man7.org/linux/man-pages/man1/sar.1.html
- ↑ 6.0 6.1 https://en.wikipedia.org/wiki/Cron
- ↑ 7.0 7.1 https://man7.org/linux/man-pages/man1/sadf.1.html
- ↑ https://www.man7.org/linux/man-pages/man8/sa1.8.html