Registered User mNo edit summary |
Registered User mNo edit summary |
||
| (11 intermediate revisions by 4 users not shown) | |||
| Line 1: | Line 1: | ||
<noinclude>{{ApplicableFor | |||
|MPUs list=STM32MP13x, STM32MP15x, STM32MP21x, STM32MP23x, STM32MP25x | |||
|MPUs checklist=STM32MP13x, STM32MP15x, STM32MP21x, STM32MP23x, STM32MP25x | |||
}} | |||
</noinclude> | |||
==Article purpose== | ==Article purpose== | ||
This article provides the basic information needed to start using the Linux<sup>®</sup> tracing tool: '''LTTng'''<ref name=lttngdotorg/> (Linux Trace Toolkit, next generation). | This article provides the basic information needed to start using the Linux<sup>®</sup> tracing tool: '''LTTng'''<ref name="lttngdotorg" /> (Linux Trace Toolkit, next generation). | ||
==Introduction== | ==Introduction== | ||
| Line 13: | Line 19: | ||
</onlyinclude> | </onlyinclude> | ||
|} | |} | ||
This tool is composed of 3 parts: | This tool is composed of 3 parts: | ||
* lttng-ust: user space libs | *lttng-ust: user space libs | ||
* lttng-tools: user space tools | *lttng-tools: user space tools | ||
* lttng-modules: kernel modules | *lttng-modules: kernel modules | ||
== Installing the trace and debug tool on your target board == | ==Installing the trace and debug tool on your target board == | ||
=== Using STM32MPU Embedded Software distribution === | === Using STM32MPU Embedded Software distribution=== | ||
OpenSTLinux embeds lttng-ust and lttng-tools by default. | OpenSTLinux embeds lttng-ust and lttng-tools by default. | ||
The LTTng Kernel space is not installed/activated by default in OpenSTLinux to avoid increasing the roofs size. | The LTTng Kernel space is not installed/activated by default in OpenSTLinux to avoid increasing the roofs size. | ||
To use LTTng in OpenSTLinux you need to both: | To use LTTng in OpenSTLinux you need to both: | ||
* {{highlight|activate 'Kernel Function Tracer'}}. the Linux kernel configuration must activate CONFIG_FUNCTION_TRACER and CONFIG_FUNCTION_GRAPH_TRACER using the Linux kernel Menuconfig tool ([[Menuconfig or how to configure kernel]]): | *{{highlight|activate 'Kernel Function Tracer'}}. the Linux kernel configuration must activate CONFIG_FUNCTION_TRACER and CONFIG_FUNCTION_GRAPH_TRACER using the Linux kernel Menuconfig tool ([[Menuconfig or how to configure kernel]]): | ||
Symbol: '''FUNCTION_TRACER''' | Symbol: '''FUNCTION_TRACER''' | ||
Location: | Location: | ||
| Line 39: | Line 45: | ||
{{highlight|[*] Kernel Function Graph Tracer}} | {{highlight|[*] Kernel Function Graph Tracer}} | ||
{{Info| | {{Info| | ||
''This trace framework is not activated by default in OpenSTLinux distributions since there is an impact on the Linux kernel size (around 1.5% increase of vmlinux), and also an impact on the overall performance, because of additional processing done to trace kernel events and function calls''.}} | ''This trace framework is not activated by default in OpenSTLinux distributions since there is an impact on the Linux kernel size (around 1.5% increase of vmlinux), and also an impact on the overall performance, because of additional processing done to trace kernel events and function calls''.}} | ||
* {{highlight|compile and install lttng- | *{{highlight|compile and install lttng-tools}} | ||
'''lttng''' is integrated in weston image distribution through openembedded-core package: ''openembedded-core/meta/recipes-core/packagegroups/packagegroup-core-tools-profile.bb''. | '''lttng''' is integrated in weston image distribution through openembedded-core package: ''openembedded-core/meta/recipes-core/packagegroups/packagegroup-core-tools-profile.bb''. | ||
RDEPENDS:${PN} = "\ | |||
${PROFILETOOLS} \ | ${PROFILETOOLS} \ | ||
{{green|'''${LTTNGTOOLS}'''}} \ | {{green|'''${LTTNGTOOLS}'''}} \ | ||
${BABELTRACE} \ | ${BABELTRACE} \ | ||
${BABELTRACE2} \ | |||
${SYSTEMTAP} \ | ${SYSTEMTAP} \ | ||
${VALGRIND} \ | ${VALGRIND} \ | ||
" | " | ||
==== Developer Package ==== | However, lttng-tools is removed in meta-st package: <code>''meta-st/meta-st-openstlinux/recipes-core/packagegroups/packagegroup-core-tools-profile.bbappend''</code>. | ||
It is not recommended to enable Linux kernel configuration for LTTng by using Developer Package because all external modules should also be recompiled (''e.g. gcnano driver for GPU | RDEPENDS:${PN}:remove = "${LTTNGTOOLS}" | ||
====Developer Package==== | |||
It is not recommended to enable Linux kernel configuration for LTTng by using Developer Package because all external modules should also be recompiled (''e.g. gcnano driver for {{MicroprocessorDevice | device=15}} and {{MicroprocessorDevice | device=25}} GPU when supported''), and this is not possible with Developer Package (which does not necessary provide all sources). | |||
That is the reason why this is set as 'not supported' for Developer Package. | That is the reason why this is set as 'not supported' for Developer Package. | ||
==== Distribution Package ==== | ====Distribution Package==== | ||
{{highlight|If you have already activated the requested configuration for [[Ftrace|ftrace]], then you can go directly to "Compile lttng- | {{highlight|If you have already activated the requested configuration for [[Ftrace|ftrace]], then you can go directly to "Compile lttng-tools" item.}} | ||
* Activate requested Linux kernel configuration: please refer to [[Ftrace#Distribution_Package]]. | *Activate requested Linux kernel configuration: please refer to [[Ftrace#Distribution_Package]]. | ||
* Compile lttng- | *Compile lttng-tools | ||
:Comment line meta- | :Comment line meta-openst-linux package: <code>''meta-st/meta-st-openstlinux/recipes-core/packagegroups/packagegroup-core-tools-profile.bbappend''</code>. | ||
{{red|- | {{red|-RDEPENDS:${PN}:remove = "${LTTNGTOOLS}"}} | ||
{{green|+# | {{green|+#RDEPENDS:${PN}:remove = "${LTTNGTOOLS}"}} | ||
* Re-build the image in order to integrate new Linux kernel uImage and LTTng modules. | * Re-build the image in order to integrate new Linux kernel uImage and LTTng modules. | ||
{{PC$}} bitbake st-image-weston | {{PC$}}bitbake st-image-weston | ||
* Flashload partition images. See [[ | *Flashload partition images. See [[STM32MPU Distribution Package#Flashing the built image|Flashing the built image]]. | ||
== Getting started == | ==Getting started== | ||
The best way to ''get started'' with LTTng is to have a look to the official webpage of LTTng<ref name=lttngdotorg/>. | The best way to ''get started'' with LTTng is to have a look to the official webpage of LTTng<ref name="lttngdotorg" />. | ||
=== Activate and generate traces on target side === | ===Activate and generate traces on target side=== | ||
Some useful information can be found in LTTng documentation<ref>http://lttng.org/docs/v2. | Some useful information can be found in LTTng documentation<ref>http://lttng.org/docs/v2.13/</ref>. | ||
Kernel tracing example<ref>http://lttng.org/docs/v2. | Kernel tracing example<ref>http://lttng.org/docs/v2.13/#doc-tracing-the-linux-kernel</ref>: | ||
Create a tracing session: | Create a tracing session: | ||
{{Board$}} lttng create my-kernel-session | {{Board$}}lttng create my-kernel-session | ||
List the available kernel tracepoints and system calls: | List the available kernel tracepoints and system calls: | ||
{{Board$}} lttng list --kernel | {{Board$}}lttng list --kernel | ||
{{Board$}}lttng list --kernel --syscall | |||
Create an event rule that matches the desired event names, for example sched_switch and sched_process_fork: | Create an event rule that matches the desired event names, for example sched_switch and sched_process_fork: | ||
{{Board$}} lttng enable-event --kernel sched_switch,sched_process_fork | {{Board$}}lttng enable-event --kernel sched_switch,sched_process_fork | ||
You can also create an event rule that matches all the Linux kernel tracepoints (this will generate a lot of data when tracing): | You can also create an event rule that matches all the Linux kernel tracepoints (this will generate a lot of data when tracing): | ||
{{Board$}} lttng enable-event --kernel --all | {{Board$}}lttng enable-event --kernel --all | ||
Start tracing: | Start tracing: | ||
{{Board$}} lttng start | {{Board$}}lttng start | ||
Generate activity on your system for a few seconds. For example, start an application, load a kernel module, or list the files within a directory... | Generate activity on your system for a few seconds. For example, start an application, load a kernel module, or list the files within a directory... | ||
Stop tracing and destroy the tracing session: | Stop tracing and destroy the tracing session: | ||
{{Board$}} lttng stop | {{Board$}}lttng stop | ||
{{Board$}} lttng destroy | {{Board$}}lttng destroy | ||
The '''destroy''' command does not destroy the trace data; it only destroys the state of the tracing session. | The '''destroy''' command does not destroy the trace data; it only destroys the state of the tracing session. | ||
=== Import LTTng traces in a Trace Compass trace viewer === | ===Import LTTng traces in a Trace Compass trace viewer === | ||
==== Host Installation for Trace Compass ==== | ====Host Installation for Trace Compass==== | ||
Even if LTTng are tools running on target, the analysis of the traces generated by LTTng tools should be done with host tools like '''Trace Compass'''<ref name=tracecompassdotorg/>. | Even if LTTng are tools running on target, the analysis of the traces generated by LTTng tools should be done with host tools like '''Trace Compass'''<ref name="tracecompassdotorg" />. | ||
So first you have to download and install/run the Trace Compass tool<ref>https://www.eclipse.org/tracecompass/#getting</ref>: download the last version (or at least TraceCompass-3.2.0). | So first you have to download and install/run the Trace Compass tool<ref>https://www.eclipse.org/tracecompass/#getting</ref>: download the last version (or at least TraceCompass-3.2.0). | ||
==== Visualize LTTng trace with Trace Compass ==== | ====Visualize LTTng trace with Trace Compass==== | ||
Once the trace have been generated you can use Trace Compass<ref name=tracecompassdotorg/> to visualize your traces, interpreted in dedicated context view. | Once the trace have been generated you can use Trace Compass<ref name="tracecompassdotorg" /> to visualize your traces, interpreted in dedicated context view. | ||
* First ensure you can open an ssh session with your board. {{highlight|But close it after, because no ssh session must be open for the next steps}} | *First ensure you can open an ssh session with your board. {{highlight|But close it after, because no ssh session must be open for the next steps}} | ||
{{PC$}} ssh root@{{HighlightParam|''<ip_of_remote_board>''}} | {{PC$}}ssh root@{{HighlightParam|''<ip_of_remote_board>''}} | ||
{{Board$}} | {{Board$}} | ||
{{Board$}} exit | {{Board$}}exit | ||
logout | logout | ||
Connection to {{HighlightParam|''<ip_of_remote_board>''}} closed. | Connection to {{HighlightParam|''<ip_of_remote_board>''}} closed. | ||
{{PC$}} | {{PC$}} | ||
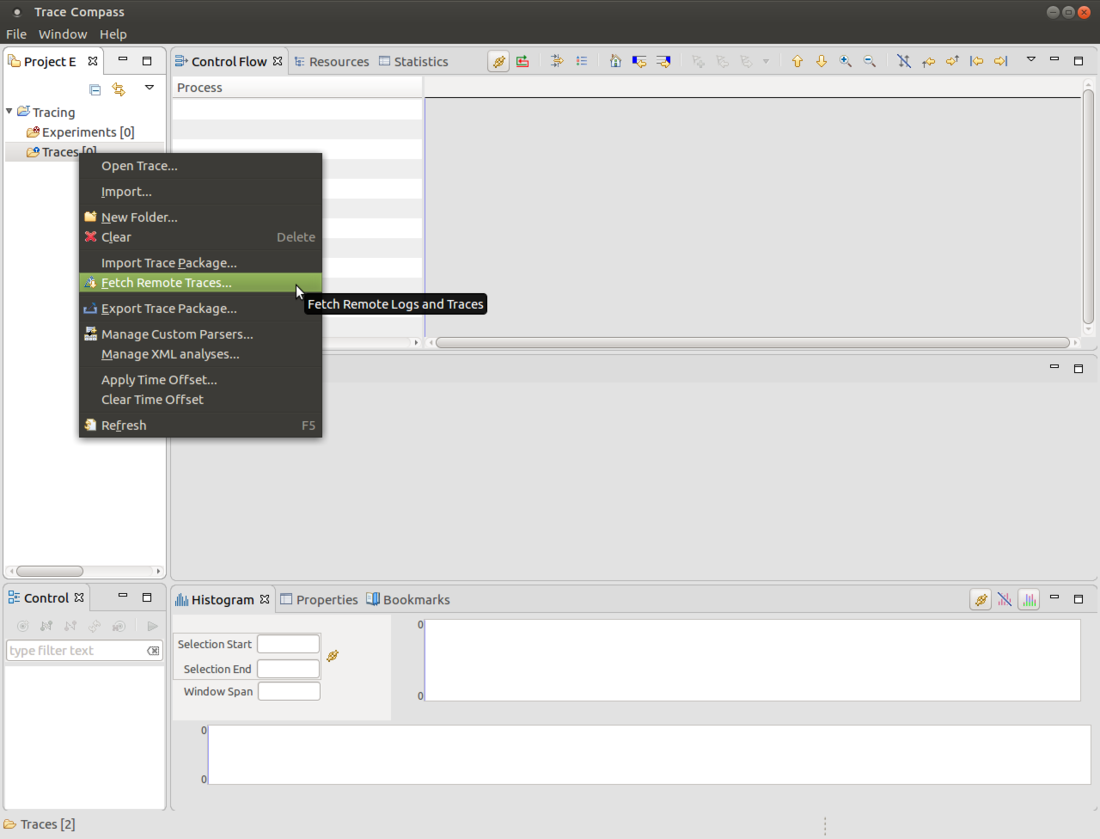
* Open Trace Compass and fetch the remote trace: | *Open Trace Compass and fetch the remote trace: | ||
[[File:traceCompass_fetchRemoteTrace.png|1100px|link=]] | [[File:traceCompass_fetchRemoteTrace.png|1100px|link=]] | ||
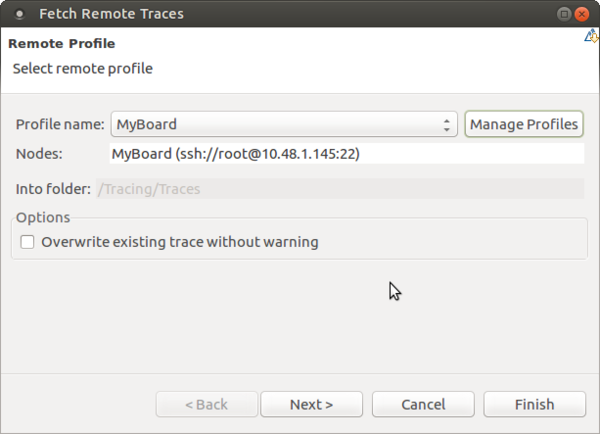
* Click on Manage profile to select/add the profile matching your setup (STBoards connection through ssh, ...) | *Click on Manage profile to select/add the profile matching your setup (STBoards connection through ssh, ...) | ||
[[File:TraceCompass_ManageProfile.png|600px|link=]] | [[File:TraceCompass_ManageProfile.png|600px|link=]] | ||
| Line 132: | Line 139: | ||
[[File:TraceCompass_ManageProfileAdd.png|600px|link=]] | [[File:TraceCompass_ManageProfileAdd.png|600px|link=]] | ||
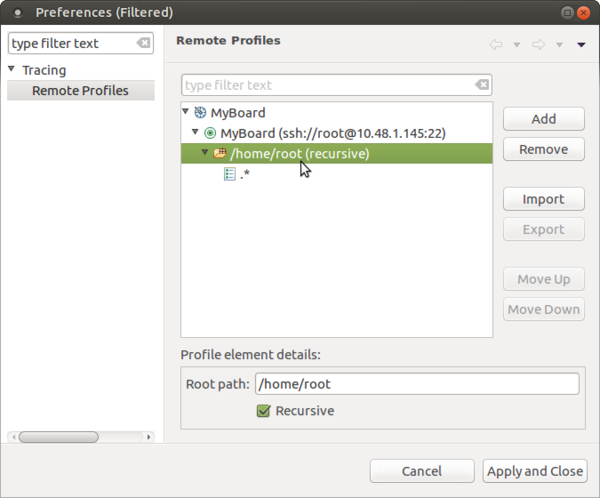
* Take care about the search path, by default Trace Compass looks for a wrong search path, please correct it | *Take care about the search path, by default Trace Compass looks for a wrong search path, please correct it | ||
[[File:traceCompass_setRemoteSearchPath.png|600px|link=]] | [[File:traceCompass_setRemoteSearchPath.png|600px|link=]] | ||
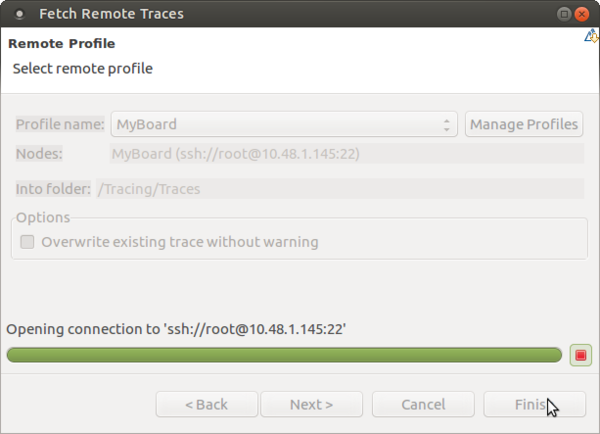
* End by clicking on finish button<br> | *End by clicking on finish button<br> | ||
{{highlight|Note that sometimes it fails to get logs at the first trial, do not hesitate to try again.}}<br /> | {{highlight|Note that sometimes it fails to get logs at the first trial, do not hesitate to try again. If it keeps failing, you can still copy manually the traces directories onto your host with scp for instance.}}<br /> | ||
[[File:TraceCompass_FetchRemoteTraceFinish.png|600px|link=]] | [[File:TraceCompass_FetchRemoteTraceFinish.png|600px|link=]] | ||
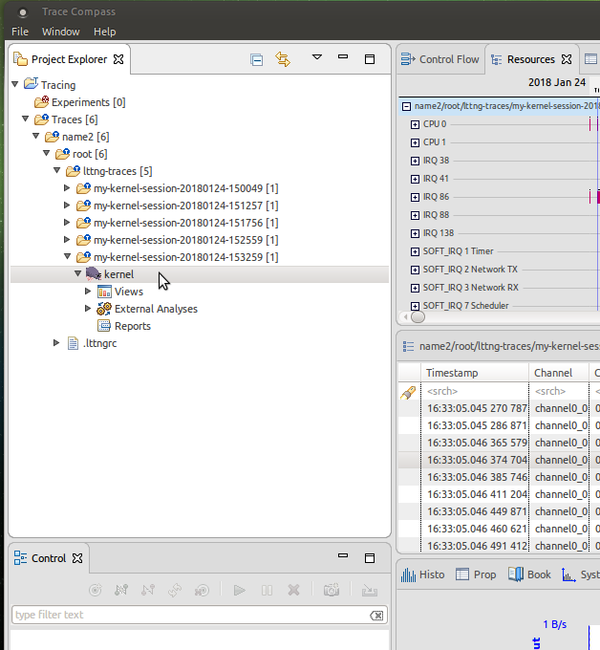
* Your traces will be loaded on Trace Compass, and you can see them on the Project explorer on the left. | *Your traces will be loaded on Trace Compass, and you can see them on the Project explorer on the left. | ||
In the example below 5 traces have been loaded:<br /> | In the example below 5 traces have been loaded:<br /> | ||
[[File:TraceCompass_TraceLoading.png|600px|link=]] | [[File:TraceCompass_TraceLoading.png|600px|link=]] | ||
* Open the trace | *Open the trace | ||
To open the trace, left-click on the {{highlight|kernel}} item corresponding to your trace, then '''Open'''. | To open the trace, left-click on the {{highlight|kernel}} item corresponding to your trace, then '''Open'''. | ||
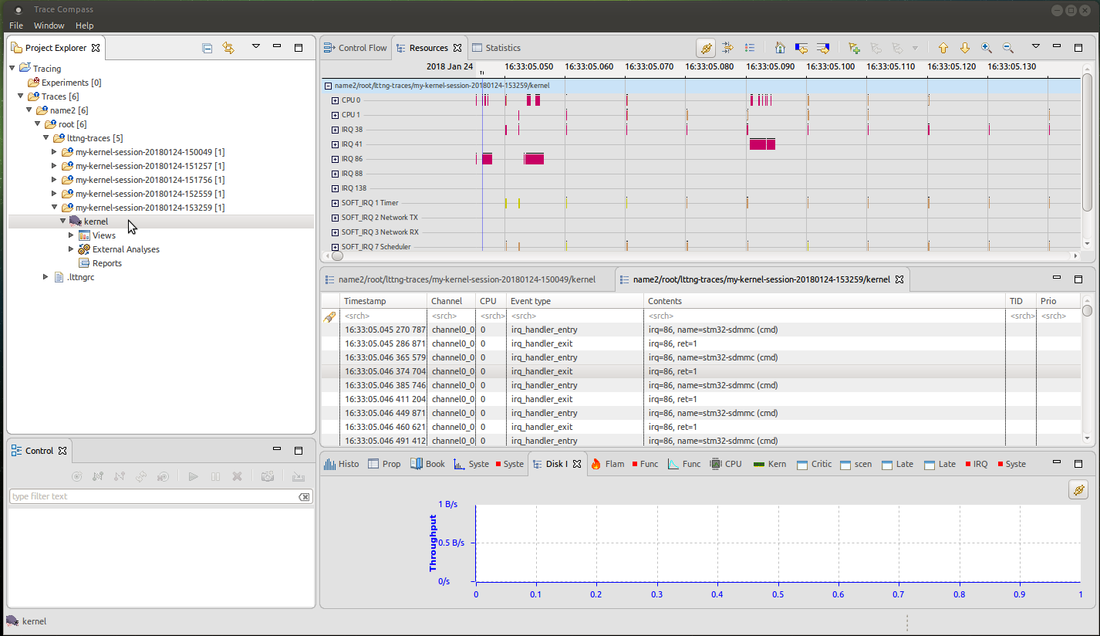
* Check for trace on the right panels | *Check for trace on the right panels | ||
[[File:TraceCompass_TraceDisplay.png|1100px|link=]] | [[File:TraceCompass_TraceDisplay.png|1100px|link=]] | ||
== References == | ==References== | ||
<references /> | <references /> | ||
{{ ArticleBasedOnModel | Trace and debug tools article model }} | <noinclude> | ||
{{ PublicationRequestId | 9569 | 14Nov'18 }} | {{ArticleBasedOnModel | Trace and debug tools article model }} | ||
{{PublicationRequestId | 9569 | 14Nov'18 }} | |||
[[Category:Linux tracing tools]] | [[Category:Linux tracing tools]] | ||
</noinclude> | |||
Latest revision as of 17:36, 20 June 2025
1. Article purpose[edit | edit source]
This article provides the basic information needed to start using the Linux® tracing tool: LTTng[1] (Linux Trace Toolkit, next generation).
2. Introduction[edit | edit source]
The following table provides a brief description of the tool, as well as its availability depending on the software packages:
![]() : this tool is either present (ready to use or to be activated), or can be integrated and activated on the software package.
: this tool is either present (ready to use or to be activated), or can be integrated and activated on the software package.
![]() : this tool is not present and cannot be integrated, or it is present but cannot be activated on the software package.
: this tool is not present and cannot be integrated, or it is present but cannot be activated on the software package.
| Tool | STM32MPU Embedded Software distribution | STM32MPU Embedded Software distribution for Android™ | ||||||
|---|---|---|---|---|---|---|---|---|
| Name | Category | Purpose | Starter Package | Developer Package | Distribution Package | Starter Package | Developer Package | Distribution Package |
| LTTng | Tracing tools | LTTng[1] is an open source tracing framework for Linux kernel and user spaces. It is a powerful tool that can be used for many purposes. LTTng traces need to be processed/displayed with a host tool such as Trace Compass[2], based on Eclipse plugin for increased portability. | ||||||
This tool is composed of 3 parts:
- lttng-ust: user space libs
- lttng-tools: user space tools
- lttng-modules: kernel modules
3. Installing the trace and debug tool on your target board[edit | edit source]
3.1. Using STM32MPU Embedded Software distribution[edit | edit source]
OpenSTLinux embeds lttng-ust and lttng-tools by default.
The LTTng Kernel space is not installed/activated by default in OpenSTLinux to avoid increasing the roofs size.
To use LTTng in OpenSTLinux you need to both:
- activate 'Kernel Function Tracer'. the Linux kernel configuration must activate CONFIG_FUNCTION_TRACER and CONFIG_FUNCTION_GRAPH_TRACER using the Linux kernel Menuconfig tool (Menuconfig or how to configure kernel):
Symbol: FUNCTION_TRACER
Location:
  Kernel Hacking --->
    Tracers -->
      [*] Kernel Function Tracer

Symbol: FUNCTION_GRAPH_TRACER
Location:
  Kernel Hacking --->
    Tracers -->
      [*] Kernel Function Tracer
       [*] Kernel Function Graph Tracer
|
This trace framework is not activated by default in OpenSTLinux distributions since there is an impact on the Linux kernel size (around 1.5% increase of vmlinux), and also an impact on the overall performance, because of additional processing done to trace kernel events and function calls. |
- compile and install lttng-tools
lttng is integrated in weston image distribution through openembedded-core package: openembedded-core/meta/recipes-core/packagegroups/packagegroup-core-tools-profile.bb.
RDEPENDS:${PN} = "\
    ${PROFILETOOLS} \
    ${LTTNGTOOLS} \
    ${BABELTRACE} \
    ${BABELTRACE2} \
    ${SYSTEMTAP} \
    ${VALGRIND} \
    "
However, lttng-tools is removed in meta-st package: meta-st/meta-st-openstlinux/recipes-core/packagegroups/packagegroup-core-tools-profile.bbappend.
RDEPENDS:${PN}:remove = "${LTTNGTOOLS}"
3.1.1. Developer Package[edit | edit source]
It is not recommended to enable Linux kernel configuration for LTTng by using Developer Package because all external modules should also be recompiled (e.g. gcnano driver for STM32MP15x lines ![]() and STM32MP25x lines
and STM32MP25x lines ![]() GPU when supported), and this is not possible with Developer Package (which does not necessary provide all sources).
GPU when supported), and this is not possible with Developer Package (which does not necessary provide all sources).
That is the reason why this is set as 'not supported' for Developer Package.
3.1.2. Distribution Package[edit | edit source]
If you have already activated the requested configuration for ftrace, then you can go directly to "Compile lttng-tools" item.
- Activate requested Linux kernel configuration: please refer to Ftrace#Distribution_Package.
- Compile lttng-tools
- Comment line meta-openst-linux package:
meta-st/meta-st-openstlinux/recipes-core/packagegroups/packagegroup-core-tools-profile.bbappend.
-RDEPENDS:${PN}:remove = "${LTTNGTOOLS}"
+#RDEPENDS:${PN}:remove = "${LTTNGTOOLS}"
- Re-build the image in order to integrate new Linux kernel uImage and LTTng modules.
PC $>bitbake st-image-weston
- Flashload partition images. See Flashing the built image.
4. Getting started[edit | edit source]
The best way to get started with LTTng is to have a look to the official webpage of LTTng[1].
4.1. Activate and generate traces on target side[edit | edit source]
Some useful information can be found in LTTng documentation[3].
Kernel tracing example[4]:
Create a tracing session:
Board $>lttng create my-kernel-session

List the available kernel tracepoints and system calls:
Board $>lttng list --kernel
Board $>lttng list --kernel --syscall

Create an event rule that matches the desired event names, for example sched_switch and sched_process_fork:
Board $>lttng enable-event --kernel sched_switch,sched_process_fork

You can also create an event rule that matches all the Linux kernel tracepoints (this will generate a lot of data when tracing):
Board $>lttng enable-event --kernel --all

Start tracing:
Board $>lttng start

Generate activity on your system for a few seconds. For example, start an application, load a kernel module, or list the files within a directory...

Stop tracing and destroy the tracing session:
Board $>lttng stop
Board $>lttng destroy
The destroy command does not destroy the trace data; it only destroys the state of the tracing session.
4.2. Import LTTng traces in a Trace Compass trace viewer[edit | edit source]
4.2.1. Host Installation for Trace Compass[edit | edit source]
Even if LTTng are tools running on target, the analysis of the traces generated by LTTng tools should be done with host tools like Trace Compass[2].
So first you have to download and install/run the Trace Compass tool[5]: download the last version (or at least TraceCompass-3.2.0).
4.2.2. Visualize LTTng trace with Trace Compass[edit | edit source]
Once the trace have been generated you can use Trace Compass[2] to visualize your traces, interpreted in dedicated context view.
- First ensure you can open an ssh session with your board. But close it after, because no ssh session must be open for the next steps
PC $>ssh root@<ip_of_remote_board>

Board $>
Board $>exit
logout
Connection to <ip_of_remote_board> closed.

PC $>
- Open Trace Compass and fetch the remote trace:
- Click on Manage profile to select/add the profile matching your setup (STBoards connection through ssh, ...)
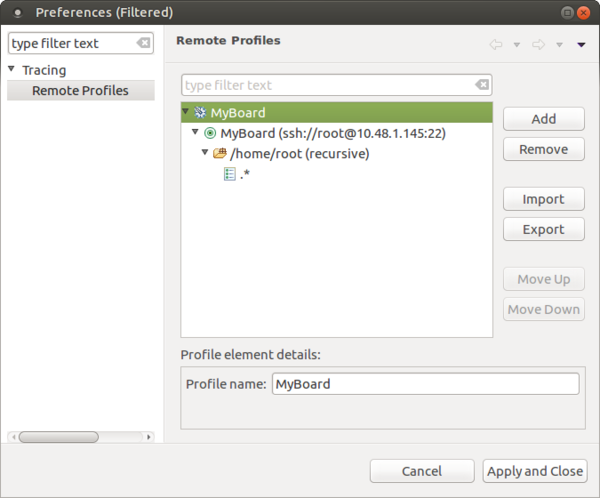
- If needed add a new profile: in this case, a profile named STBoards with ssh connection
- Take care about the search path, by default Trace Compass looks for a wrong search path, please correct it
- End by clicking on finish button
Note that sometimes it fails to get logs at the first trial, do not hesitate to try again. If it keeps failing, you can still copy manually the traces directories onto your host with scp for instance.
- Your traces will be loaded on Trace Compass, and you can see them on the Project explorer on the left.
In the example below 5 traces have been loaded:
- Open the trace
To open the trace, left-click on the kernel item corresponding to your trace, then Open.
- Check for trace on the right panels
5. References[edit | edit source]