Registered User (Merge articles) |
Registered User (Merge articles) |
||
| (3 intermediate revisions by the same user not shown) | |||
| Line 1: | Line 1: | ||
This article does not intend to cover all STM32CubeIDE Serial Wire Viewer (SWV) capabilities | <noinclude>{{ApplicableFor | ||
|MPUs list=STM32MP15x | |||
|MPUs checklist=STM32MP13x, STM32MP15x | |||
}}</noinclude> | |||
This article does not intend to cover all STM32CubeIDE Serial Wire Viewer (SWV) capabilities. It only provides some setup information for debugging the Cortex<sup>®</sup>-M of STM32MP15xx microprocessors in ''Production Mode''. Complete information is available in the chapter 4 of STM32CubeIDE user guide ([[STM32MP15 resources#UM2609|UM2609]]). | |||
<br> | <br> | ||
<br> | <br> | ||
In | In this mode, the available console on the board (UART4) is used by the Cortex<sup>®</sup>-A Linux<sup>®</sup>. The clock tree is managed by Linux<sup>®</sup> and 'Trace clock' needed to setup SWO is available from Linux<sup>®</sup> console with command: <br> | ||
'''''awk '/ck_trace/{print $5}' /sys/kernel/debug/clk/clk_summary''''' | '''''awk '/ck_trace/{print $5}' /sys/kernel/debug/clk/clk_summary''''' | ||
<br> | <br> | ||
<br> | <br> | ||
To make a test, modify file main.c from a generated project with a looping variable 'i', as depicted below. | |||
<br> | <br> | ||
[[File:Swv-traceclk-linux-main.png|frame|center|''Trace clock from Linux console'']] | [[File:Swv-traceclk-linux-main.png|frame|center|''Trace clock from the Linux<sup>®</sup> console'']] | ||
<br> | <br> | ||
<br> | <br> | ||
Then, setup debug configuration, enabling SWV and setting the clock: 133. | Then, setup the debug configuration, enabling SWV and setting the clock: 133.25 MHz in the example below. | ||
<br> | <br> | ||
[[File:Swv-dbg-cfg.png|frame|center|''Debug | [[File:Swv-dbg-cfg.png|frame|center|''Debug configuration with SWV enabled]] | ||
<br> | <br> | ||
<br> | <br> | ||
Stop the debug session and open Serial Wire Views: ''Window'' > ''Show View'' > ''Other...'' > ''SWV'' > ''SWV Trace Log & SWV Data Trace''. <br> | |||
In ''SWV Trace Log > Configure Trace'' menu, | In the ''SWV Trace Log'' > ''Configure Trace'' menu, set up ''Comparator 0'' in order to spy variable 'i'. | ||
[[File:SWVConfigureTraceButton.png|none|frameless]] | [[File:SWVConfigureTraceButton.png|none|frameless]] | ||
<br> | <br> | ||
[[File:Swv-settings.png|frame|center|''SWV | [[File:Swv-settings.png|frame|center|''SWV setting'']] | ||
Then start the trace [[File:SWVStartTraceButton.png|none|frameless]] | Then start the trace. [[File:SWVStartTraceButton.png|none|frameless]] | ||
Resuming debug session gives inside ''SWV Data Trace'' view | Resuming the debug session gives the corresponding graphic shown below inside the ''SWV Data Trace'' view. | ||
<br> | <br> | ||
[[File:Swv-data-trace.png|frame|center|''SWV | [[File:Swv-data-trace.png|frame|center|''SWV data trace output'']] | ||
<noinclude> | <noinclude> | ||
[[Category:STM32CubeIDE|51]] | [[Category:STM32CubeIDE|51]] | ||
{{PublicationRequestId | 19686 (LudovicB) |2021-04-20 }} | |||
</noinclude> | </noinclude> | ||
Latest revision as of 19:32, 25 November 2021
This article does not intend to cover all STM32CubeIDE Serial Wire Viewer (SWV) capabilities. It only provides some setup information for debugging the Cortex®-M of STM32MP15xx microprocessors in Production Mode. Complete information is available in the chapter 4 of STM32CubeIDE user guide (UM2609).
In this mode, the available console on the board (UART4) is used by the Cortex®-A Linux®. The clock tree is managed by Linux® and 'Trace clock' needed to setup SWO is available from Linux® console with command:
awk '/ck_trace/{print $5}' /sys/kernel/debug/clk/clk_summary
To make a test, modify file main.c from a generated project with a looping variable 'i', as depicted below.
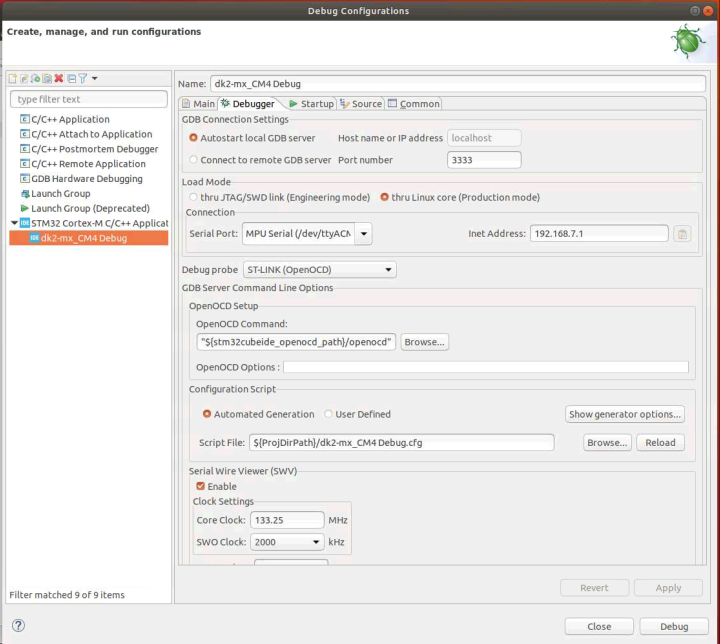
Then, setup the debug configuration, enabling SWV and setting the clock: 133.25 MHz in the example below.
Stop the debug session and open Serial Wire Views: Window > Show View > Other... > SWV > SWV Trace Log & SWV Data Trace.
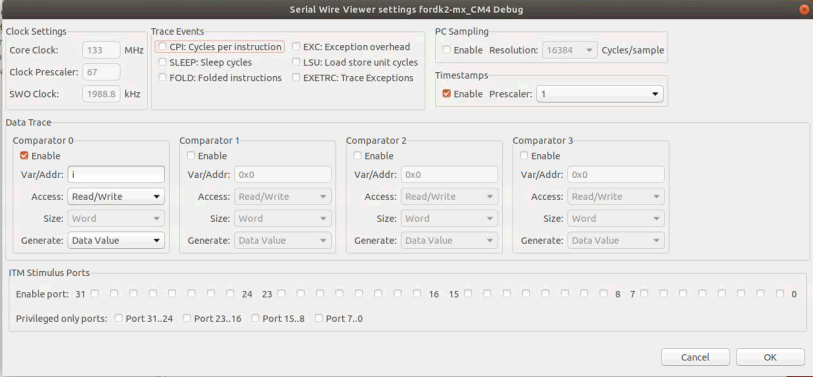
In the SWV Trace Log > Configure Trace menu, set up Comparator 0 in order to spy variable 'i'.
Then start the trace.
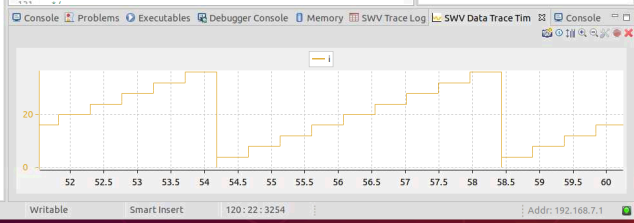
Resuming the debug session gives the corresponding graphic shown below inside the SWV Data Trace view.


