1. Introduction
The STM32CubeWBA firmware provides real time (RT) debug capabilities. The RTDebug module is GPIO based for a minimal impact on real time timings. The module is present, by default, into the application framework.
While enabling the RTDebug module in the application, the user can choose, among a various list of signals, the ones it wants to monitor and which GPIO is assigned for output.
Some default configurations are already present and can ease debugging related to System, BLE, MAC or Coexistence behaviors.
2. Concepts
2.1. RTDebug general overview
The main objectives of the RTDebug system module is to provide a GPIO probing solution:
- With accurate timings.
- That is not disturbing real time nor modifying critical executions.
- Easy to configure (debug signal selection and GPIO assignation).
- With low footprint, both memory and execution time.
Regarding these objectives, the RTDebug module is configured at compile time. Only the necessary code is compiled, according to the user configuration.
The debug signals are present, by default, in the system framework (modules and interfaces) and the Link Layer libraries (BLE, 802.15.4 and concurrent modes). If these signals are always present, the effective use is conditioned to the user configuration.
- If the signal is selected, it triggers the associated GPIO.
- If the signal is not selected at compile time, it does not trigger any GPIO.
2.2. RTDebug files
- The RTDebug files are present in two distinct repositories
- The first part comes under the System/Modules repository and must not be modified by any user.
- The second part is located in the System/Config repository and can be modified to suit user needs.
2.3. RTDebug configuration
RTDebug module configuration is done at compilation time. This aims to determined which signal is activated and to which GPIOs it is attributed. This relies on definitions, enumerations and hash tables.
Three steps are required to understand / to perform the RTDebug configuration:
- Signal definition
- Debug tables
- Association between Signal and GPIO
2.3.1. Signal definition
The signal definition takes place in the debug_signals.h header file. The signals are defined in their respective enumeration types, for instance, the system signal enumeration is named system_debug_signal_t and contains all the system relative signals. This enumeration is important since it is used later for signal activation or deactivation as a parameter. There are also dedicated enumeration for link layer or application.
The enumeration rt_debug_signal_t is the global signal definition. In this enumeration. you can find all the signals available on your target - It englobes all the possible signals.
Each signal has a specific function and is design to address a specific use case. Some are dedicated to link layer activities some others are dedicated to system events and some can be used to describe application steps.
2.3.2. Debug tables
The debug tables are like hash-tables. They are used to associate a specific signal to a given index inside the rt_debug_signal_t enumeration. They are located in the local_debug_tables.h header file.
2.3.3. Signal/GPIO association
The debug_config.h is the most useful file for RTDebug configuration since it handles the association configuration between a signal and its dedicated GPIO but also manage the activation or not of a signal.
Therefore, if you want to configure a signal activation and/or its GPIO output, you must focus on this file configuration.
2.4. RTDebug Signals
The list of signals handled by the module can not fully stand here. However, you must know that there are 3 main types of signals:
- System signals:
- Signals dedicated to system tracking
- I.e.: Low power activation, low power desactivation, system clock configuration, etc.
- Link layer signals:
- Signals dedicated to link layer activities tracking
- I.e.: HCI write done, Physical calibration, scheduler event registration, etc.
- Application signals:
- Signals that can be implemented and managed by the user.
- I.e: Application initialization, etc.
2.5. RTDebug used pins
The RTDebug is designed to be compliant with any version of the WBA product. Therefore, its pin configuration is restricted and is as follows:
| GPIO Group | Pin Number | ||||||||||||||
|---|---|---|---|---|---|---|---|---|---|---|---|---|---|---|---|
| GPIO A | 5 | 12 | 15 | ||||||||||||
| GPIO B | 3 | 4 | 8 | 12 | 15 | ||||||||||
2.6. RTDebug default configurations
To ease user debug experience, dedicated teams have already worked on default configuration for specific use cases (BLE, MAC, Coex, system, etc.).
Addressed configurations can deal with most common behaviors issues and give a quick overview of the situation.
The default configuration are present at the start of the debug_config.h file and just require the user to activate them.
3. Interfaces
The RTDebug is quite minimalist since for the main part it is already implemented inside the application, the system calls, the link layer routines, etc.
However, user could want to integrate some probing on his own work and could necessitate to access signal activation and deactivation functions.
The available function are the following:
| RT_DEBUG_GPIO_Init |
|---|
|
Description
|
| APP_DEBUG_SIGNAL_SET |
|---|
|
| APP_DEBUG_SIGNAL_RESET |
|---|
|
| APP_DEBUG_SIGNAL_TOGGLE |
|---|
|
4. How to
The following chapters explain how to configure and use the Real Time Debug.
4.1. Default configuration activation
First you must enable the RTDebug and to do so, you must indicate that you want to use the RTDebug in your app_conf.h file.
The next step is to activate the desiderated configuration in the debug_config.h file.
Depending on your need, you can select one of each already prepared configuration.
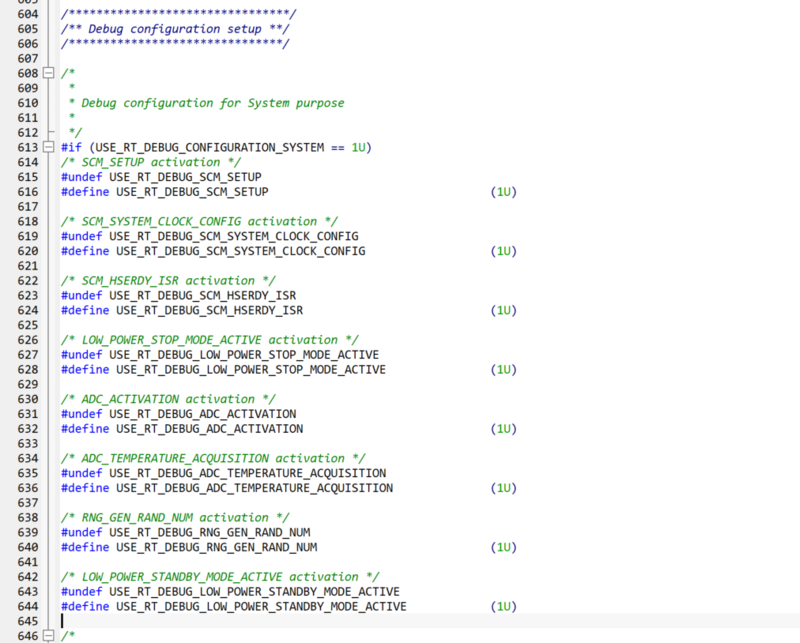
If you want to check which signal is selected, you can search for USE_RT_DEBUG_CONFIGURATION_SYSTEM for system configuration for instance. You should come to the selected signal list like below:
Following these steps, you should be able to see your signals coming to life on your GPIO signal analyzer.
4.2. Create your own configuration
If the default configurations do not fit your needs, you can actually create your own configuration by modifying the debug_config.h.
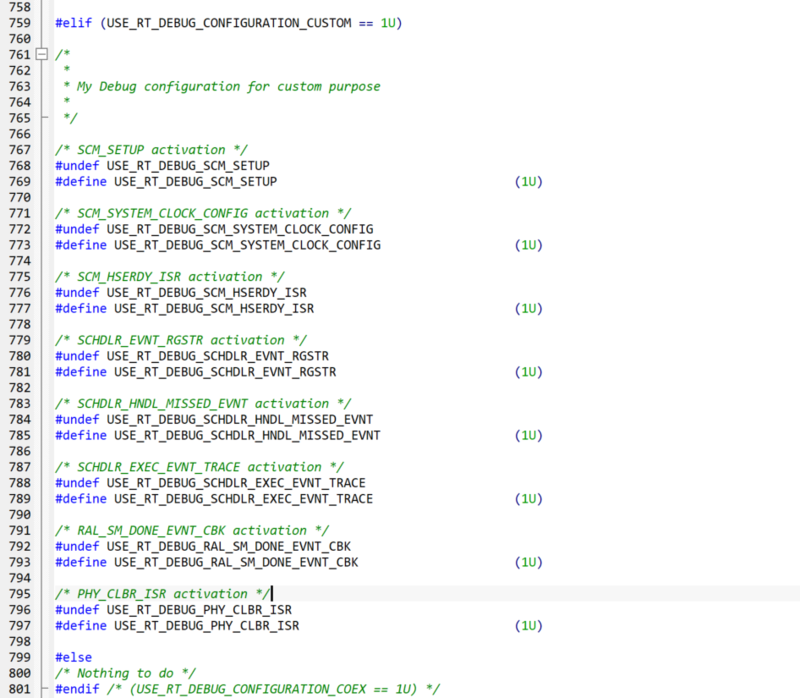
You can inspire yourself with the example of the default configurations and create a custom define that handles the signal activation of your need:
If you do not want to bother with a custom configuration, you can actually select, one by one, your signals - up to 8 - to fit your needs. You only have to activate their usage and set an adequate GPIO output. This is still done in the debug_config.h file. Like this:
Keep in mind that there are only 8 GPIOs available and no signal should share its GPIOs output with another one since the behavior of the GPIO could be misleading.
If two signals have the same output GPIO set, the result might be unpredictable, beware.
4.3. Integrate application signals
The RTDebug is not only designed for intern signals tracking but can also be used for user application step tracking.
In fact, user can create his own signals to mark the begin and the end of a step in his code.
To achieve such a thing, user can create his signal(s) to be managed by the RTDebug and, in a later time, use the RTDebug to keep track the evolution of the application process.
4.3.1. Signal creation
The signal creation is the first step to perform. It impacts two files app_debug.h and app_debug_signal_def.h.
- App_debug.h
- If you want to integrate your signal, first you need to define it inside the app_debug.h file:
- App_debug_signal_def.h
- Then, you need to declare your new signal in the rt_debug_signal_t which can be achieved only adding your signal in the app_debug_signal_def.h:
4.3.2. Hash table update
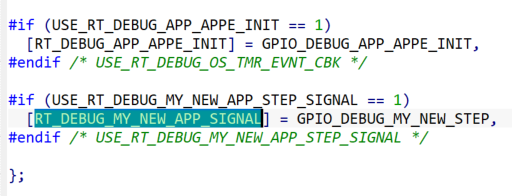
After the signal is being created, inside the app_debug.h file, you can fulfil the hash table with your new signal.
- App_debug.h
4.3.3. Debug config update
The last step consist to add the enable flag to the debug_config.h file and update the general table.
- Debug_config.h
- This way you can select the associated GPIO and enable or disable your signal in a later time:
- And update the general table with:
You can now call the public API and set, reset and toggle your own signals in your application.


