This article aims to provide a step-by-step guide to set up a vibration-based condition monitoring solution. This demonstration uses an easily available USB fan and implements a condition monitoring proof of concept using FP-AI-MONITOR1 and an STEVAL-STWINKT1B board. The anomaly detection AI library to be used in this tutorial is generated using NanoEdgeTM AI Studio and the software used to program the sensor board is provided as a function pack that can be downloaded from the ST website.
Following this article user will learn:
- How to use high-speed datalogger binary to log the vibration data on microSDTM card on STEVAL-STWINKT1B,
- How to generate the AI library for condition monitoring using NanoEdgeTM AI Studio,
- How to integrate the generated libraries to FP-AI-MONITOR1, and program the sensor-node for condition monitoring, and
- How to perform condition monitoring on the USB fan setup using live vibration data.
1. Requirements
To follow and reproduce the steps provided in this article, the reader needs following hardware and software components.
1.1. Hardware
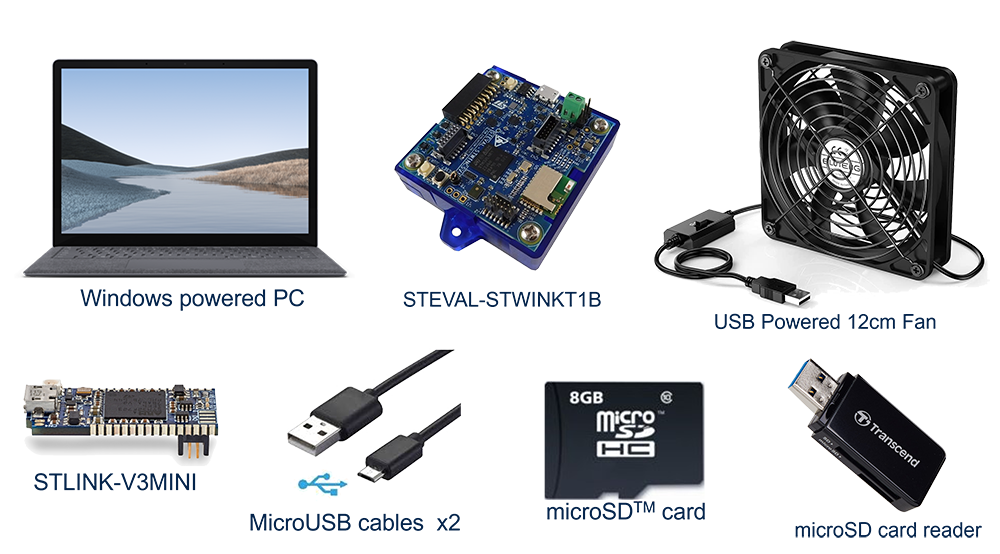
To set up this demonstration, following hardware is needed.
- An STEVAL-STWINKT1B development kit board,
- A Windows® powered laptop/PC (Windows® 10 or 11),
- An STLINK-V3MINI,
- Two micro USB cables, one to connect the STEVAL-STWINKT1B to the PC, and another one for the STLINK-V3MINI,
- A microSDTM card formatted as FAT32-FS for the data logging operation,
- A USB microSDTM card reader to read the data from the microSDTM card to the computer, and
- A USB powered fan that can be ordered from this link.
1.2. Software
- FP-AI-MONITOR1
- Download the latest version of the FP-AI-MONITOR1, package from ST website, extract and copy the
.zipfile contents into a folder on the PC. The package contains binaries and source code, for the sensor-board STEVAL-STWINKT1B.
- Download the latest version of the FP-AI-MONITOR1, package from ST website, extract and copy the
- STMicroelectronics - STM32CubeIDE version 1.8.0
- STM32CubeIDE is an all-in-one multi-OS development tool, which is part of the STM32Cube software ecosystem.
- Tera Term
- Tera Term is an open-source and freely available software terminal emulator, which is used to host the CLI of the FP-AI-MONITOR1 through a serial connection. Users can download and install the latest version available from Tera Term.
- NanoEdgeTM AI Studio
- NanoEdge™ AI Studio is a new Machine Learning (ML) technology that lets developers to create optimal ML libraries based on a minimal amount of data, for
- Anomaly Detection,
- 1-class classification,
- n-class classification, and
- extrapolation.
- This article and the function pack uses and supports only the Anomaly Detection libraries generated by NanoEdge™ AI Studio for STEVAL-STWINKT1B.
- NanoEdge™ AI Studio is a new Machine Learning (ML) technology that lets developers to create optimal ML libraries based on a minimal amount of data, for
- PythonTM 3.7.X
- To process the data logs and to prepare the data in the form which is accepted by the NanoEdgeTM AI Studio, PythonTM utility scripts are provided. These scripts are available under path
/FP-AI-MONITOR1_V1.1.0/Utilities/AI_Resources/NanoEdgeAi/. This also requires installing some dependencies for PythonTM. The list of the required packages along with their versions is available as a text file in the package at location/FP-AI-MONITOR1_V1.1.0/Utilities/AI_resources/requirements.txt. The following command is used in the command terminal of the anaconda prompt or Ubuntu to install all the packages specified in the configuration filerequirements.txt:
- To process the data logs and to prepare the data in the form which is accepted by the NanoEdgeTM AI Studio, PythonTM utility scripts are provided. These scripts are available under path
pip install -r requirements.txt
2. Condition monitoring
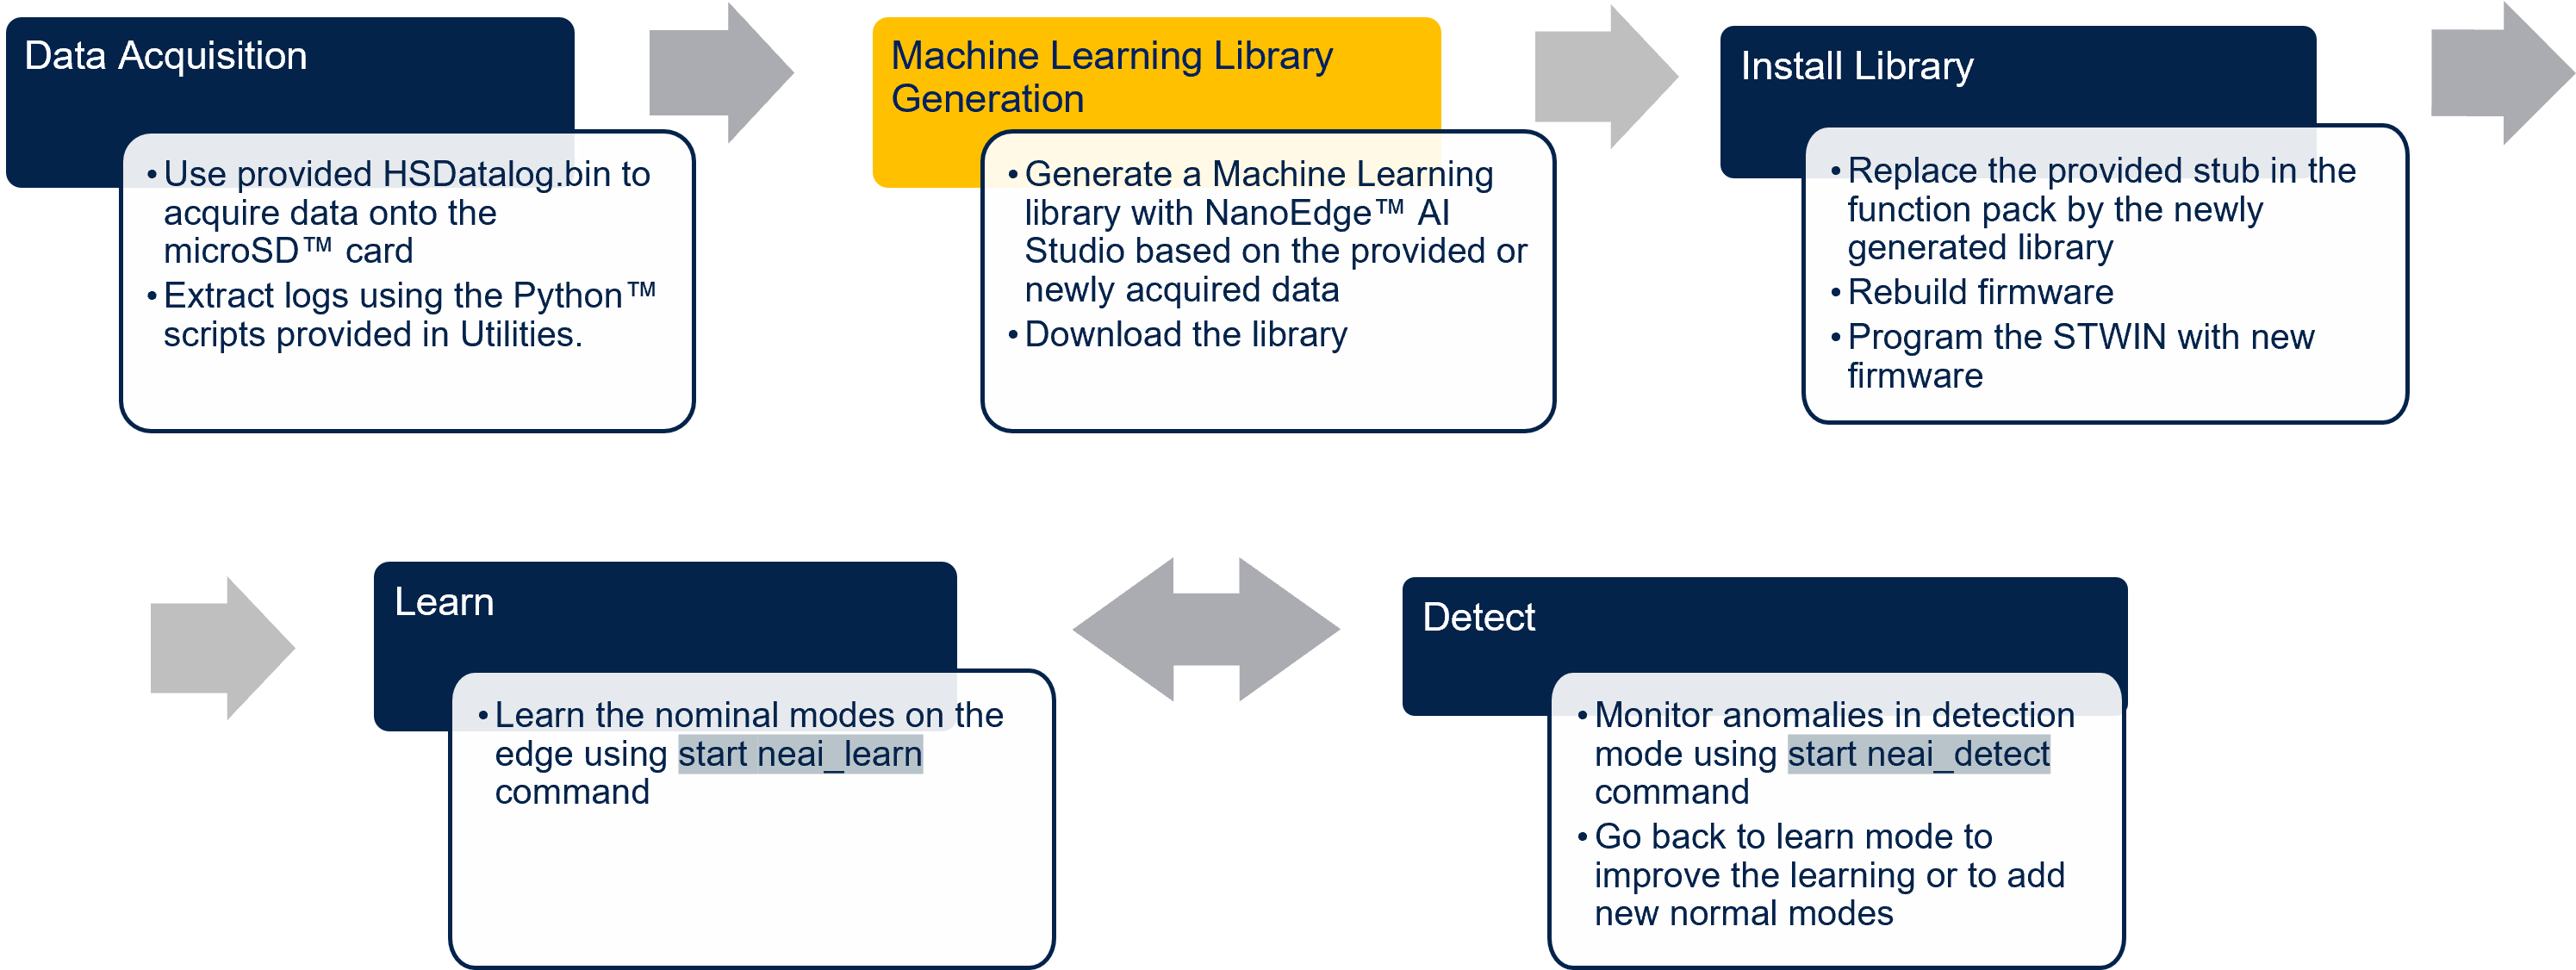
The following section describes how to set up a condition monitoring project. These steps are shown in the figure below:
2.1. Data acquisition
The anomaly detection library generation in NanoEdgeTM AI Studio requires some example data for the normal and abnormal conditions to select an optimal algorithm and library for a given setup. STEVAL-STWINKT1B is equipped with many sensors which can be used to acquire the data and create many interesting applications on this sensor-board. This section describes the steps using which we can program and configure the sensors on the STEVAL-STWINKT1B for logging the data on the microSD card.
Step 1: Program the STEVAL-STWINKT1 with the HSDatalog FW
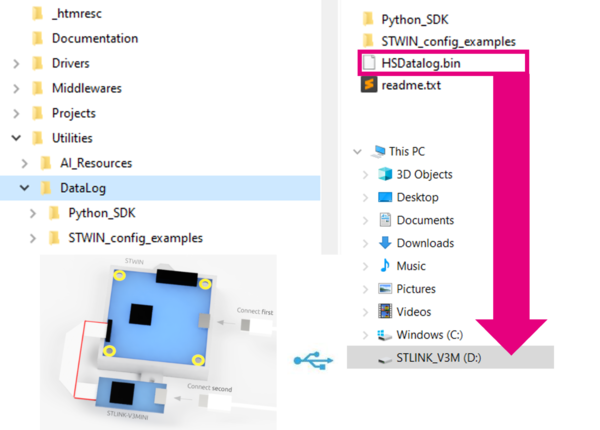
To simplify the task of the users and to allow them the possibility to perform a datalogging, a precompiled HSDatalog.bin file for FP-SNS-DATALOG1 is provided in the Utilities directory, which is located under path /FP-AI-MONITOR1_V1.1.0/Utilities/Datalog/. The sensor tile can be programmed by simply following the drag-and-drop action, as shown in the figure below.
Step 2: Place a DeviceConfig.json file on the SD card
The next step is to copy a DeviceConfig.json on the SD card. This file contains the sensors configurations to be used for the data logging. The users can simply use one of the provided sample .json files in the package in FP-AI-MONITOR1_V1.1.0/Utilities/Datalog/Sample_STWIN_Config_Files/ directory and change the values of the subSensorStatus to the required settings.
- For this demonstration, only data from ISM330DHCX sensor is used, with the following configurations, and all the other sensors are deactivates. To do so, the user can take one of the example
.jsonfiles and copy it at the root path of a microSDTM card. Rename the file asDeviceConfig.json. Edit it to deactivate all the sensors and sub sensors by specifying the values for isActive flag as false. After this enable the ACC subsensor for ISM330DHCX sensors, by setting the value of isActive flag to true for the accelerometer sub sensor. Set the odr (output data-rate) for this sensor to 1666 and Fs (full-scale) to 2.
- For this demonstration, only data from ISM330DHCX sensor is used, with the following configurations, and all the other sensors are deactivates. To do so, the user can take one of the example
Step 3: Insert the SD card into the STWIN board Insert an SD card in the STEVAL-STWINKT1B sensor tile.
Step 4: Reset the board
Reset the board. Orange LED blinks once per second. The custom sensor configurations provided in DeviceConfig.json are loaded from the file.
Step 5: Install the STEVAL-STWINKT1B on the Fan Put the STEVAL-STWINKT1B on the fan as shown in the figure above, while it is running in normal condition (with no problems). The fan being used in this demonstration has a handy controller which lets users turn on and turn off the fan, as well as run it at one of the three-speed settings. The following figure is showing the controller image.
As the readers can see the settings are labeled on the controller are:
- O: Fan is in Off state,
- L: Fan is running at Low speed (1000 RPM),
- M: Fan is running at Medium speed (1250 RPM), and
- H: Fan is running at High speed (1500 RPM).
Step 6: Start the data log Start the fan at the low speed when the button is at L settings, when the fan is stable, start the data logging by simply pressing the [USR] button on the STEVAL-STWINKT1B the green LED starts blinking to signal sensor data is being written into the SD card.
Step 7: Stop the data logging Press the [USR] button again to stop data acquisition. For this demonstration only 30 to 40 seconds long acquisitions are enough.
Repeat the step 6 and 7 for all three speeds for normal and abnormal conditions as shown in the figure above to generate six datalogs in total.
Step 8: Retrieve data from SD card
Remove the SD card, insert it into an SD card reader, and plug it to the PC. The logged data files are stored in STWIN_### folders for every acquisition, where ### is a sequential number determined by the application to ensure log file names are unique. Each folder contains a file for each active sub-sensor called SensorName_subSensorName.dat containing raw sensor data coupled with timestamps, a DeviceConfig.json with specific information about the device configuration (confirm if the sensor configurations in the DeviceConfig.json are the ones you desired), necessary for correct data interpretation, and an AcquisitionInfo.json with information about the acquisition.
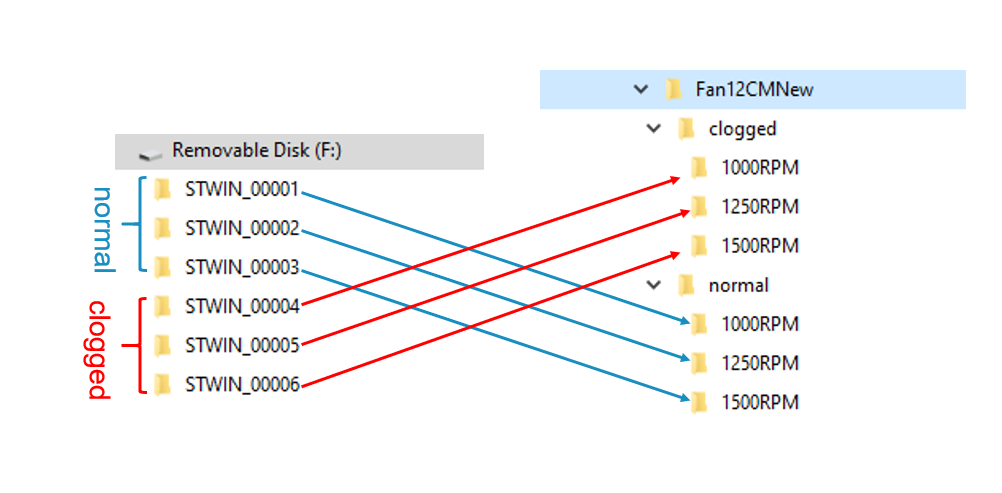
For this demonstration the process generates first three data logs for fan speeds L (1000RPM), M (1250RPM), and H (1500RPM), named as ST0001, ST0002, and ST0003 for normal condition respectively and three more data folders named as ST0004, ST0005, and ST0006 for speeds L (1000RPM), M (1250RPM) and H (1500RPM) respectively for abnormal data (i.e. clogged condition).
2.1.1. Data preparation for library generation with NanoEdgeTM AI Studio
The data logged through the datalogger is in the binary format and is neither user-readable nor compliant with the NanoEdgeTM AI Studio format as it is. To convert this data to a useful form, FP-AI-MONITOR1 provides set of PythonTM utility scripts on the path /FP-AI-MONITOR1_V1.1.0/Utilities/AI-resources/NanoEdgeAi/. There are two possibilities provided for the data parsing and preparation. A Jupyter™ Notebook and a PythonTM function as a PythonTM script file.
The Jupyter™ Notebook named as NanoEdgeAI_Utilities.ipynb provides a complete example of data preparation for a three-speed fan library generation running in normal and clogged condition. The script out of the package uses the example data provided in the package. This section guides users to exercise these scripts to generate an anomaly detection library using the six data logs generated following the instruction in the section above.
The NanoEdgeTM AI Studio expects as input one normal and one abnormal file as input for anomaly detection library generation. Hence, we need to combine the data for the three speeds for normal and clogged conditions. To use the provided scripts as it is without changing too much, we advise readers to rename and arrange their six data acquisitions as shown in the folder below.
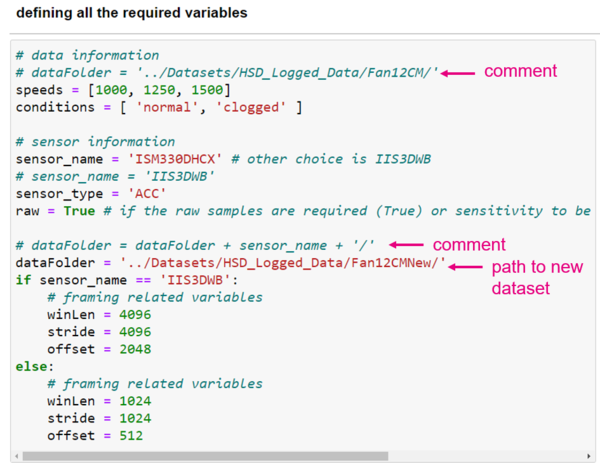
Once the datalogs are renamed, arranged and grouped as shown in the figure above, copy and paste the folder named as Fan12CMNew at the path FP-AI-MONITOR1_V1.1.0/Utilities/AI_Resources/HSD_Logged_Data/Fan12CMNew/ and open the Jupyter™ Notebook named NanoEdgeAI_Utilities.ipynb. Edit the code as shown in the screenshot below:
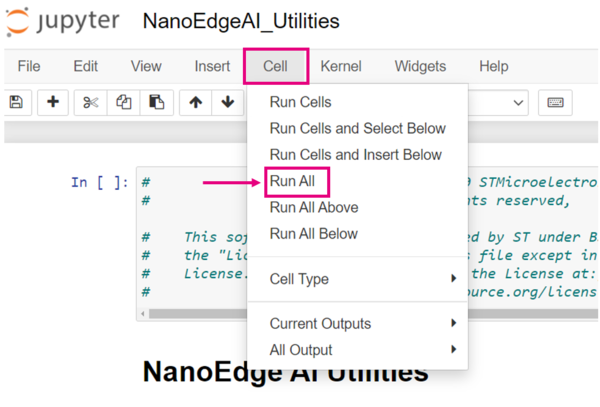
After making these changes, save the file, run all the cells either manually one-by-one or by going to the Cell menu in the toolbar, and select Run All the sections option, as shown in the figure below.
After the last section run, there are two files generated in the folder Fan12CMNew named as clogged_WL1024_segments.csv and normal_WL1024_segments.csv. Note that 1024 is an indication that the window length is 1024 samples.
The Jupyter™ Notebook is user-friendly and users can control the process of normal and abnormal file generation by changing a few parameters according to their will. As the FP-AI-MONITOR1 supports anomaly detection through both ISM330DHCX as well as IIS3DWB, the provided script can generate normal and abnormal files for inputting to NanoEdgeTM AI Studio for both sensors by just changing the name of the sensor. The default variables for the frame length and stride are set for both sensors to result in non-overlapping windows of length 1024 and 4096 for ISM330DHCX and IIS3DWB sensor. Similarly, a user can change the default values to generate overlapping frames or can change the window lengths to have longer or shorter frames. The user can also choose to add or remove some more acquisitions for the file generation process.
2.2. Generating a condition monitoring library
Running the scripts in Jupyter Notebook will generate the normal_WL1024_segments.csv and clogged_WL1024_segments.csv files. This section describes how to generate the libraries using these normal and abnormal files.
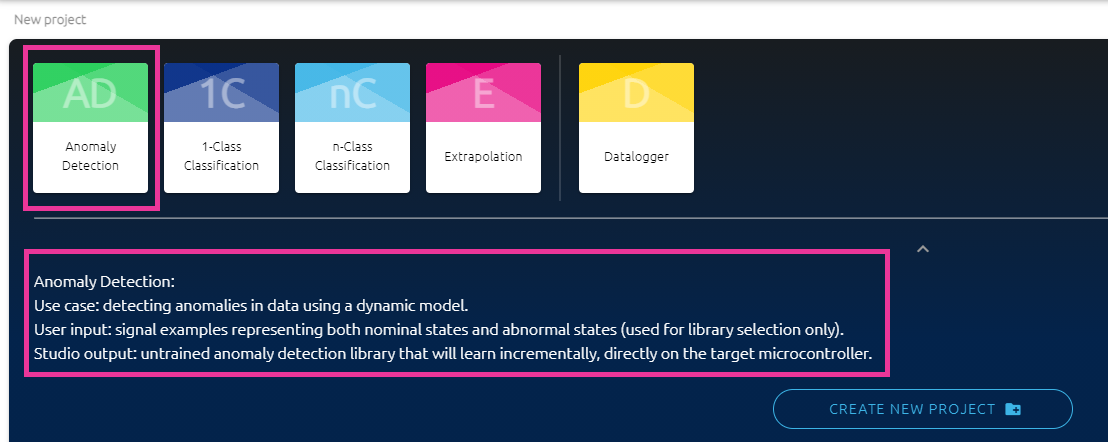
To generate the anomaly detection library the first step is to create the project by clicking on the button for AD as shown in the figure below. The text shows the information on what Anomaly Detection is good for, and the project can be created by clicking on the CREATE NEW PROJECT button.
The process to generate the anomaly detection library consists of six steps as described in the figure below:
- Project Settings
- Choose a project name and description.
- Hardware Configurations
- Choosing the target STM32 platform or a microcontroller type: STEVAL-STWINKT1B Cortex-M4 is selected by default. If that is not the case select STEVAL-STWINKT1B from the list provided in the drop-down menu under Target.
- Maximum amount of RAM to be allocated for the library: Usually, a few Kbytes is enough (but it depends on the data frame length used in the process of data preparation, 32 Kbytes is a good starting point).
- Putting a limit or no limits for the Maximum Flash budget
- Sensor type: 3-axis accelerometer is selected by default. If that is not the case select 3-axis accelerometer from the list in the drop-down under Sensor type.
- Providing the sample contextual data for normal segments to adjust and gauge the performance of the chosen model. Choose ADD SIGNAL and then from the dialog choose FROM FILE. Provide the path to the
normal_WL1024_segments.csvgenerated using Jupyter notebook, - Providing the sample contextual data for abnormal segments to adjust and gauge the performance of the chosen model. Choose ADD SIGNAL and then from the dialog choose FROM FILE. Provide the path to the
clogged_WL1024_segments.csvgenerated using Jupyter notebook, - Benchmarking of available models and choosing the one that complies with the requirements and provides the best performance.
- Validating the model for learning and testing through the provided emulator which emulates the behavior of the library on the STM32 target.
- The final step is to compile and download the libraries. In this process, the flag
"Float abi"has to becheckedfor using libraries with hardware FPU. All the other flags can be left to the default state.- Note for using the library with μKeil also check -fshort-wchar in addition to Float abi.
Detailed documentation on the NanoEdge™ AI Studio.
.
2.3. Installing the NanoEdgeTM Machine Learning library
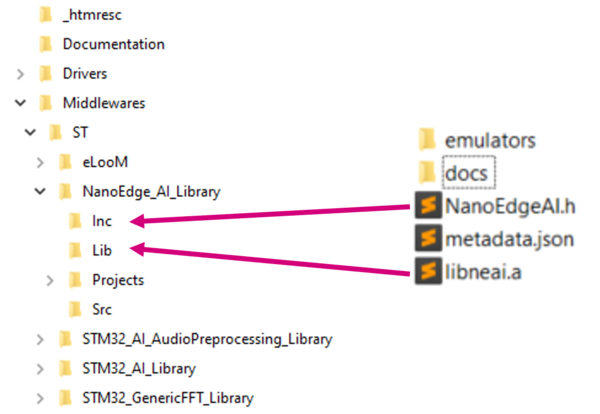
Once the libraries are generated and downloaded from NanoEdgeTM AI Studio, the next step is to link these libraries to FP-AI-MONITOR1 and run them on the STEVAL-STWINKT1B. The FP-AI-MONITOR1, comes with the library stubs in the place of the actual libraries generated by NanoEdgeTM AI Studio. This is done to simplify the linking process of the generated libraries. In order to link the generated libraries, the user needs to copy the generated libraries and replace the existing stub/dummy libraries libneai.a and header files NanoEdgeAI.h present in the folders lib and Inc, respectively as shown in the figure below. Both of these folders can be found at the path /FP_AI_MONITOR1_V1.1.0/Middlewares/ST/NanoEdge_AI_Library/.
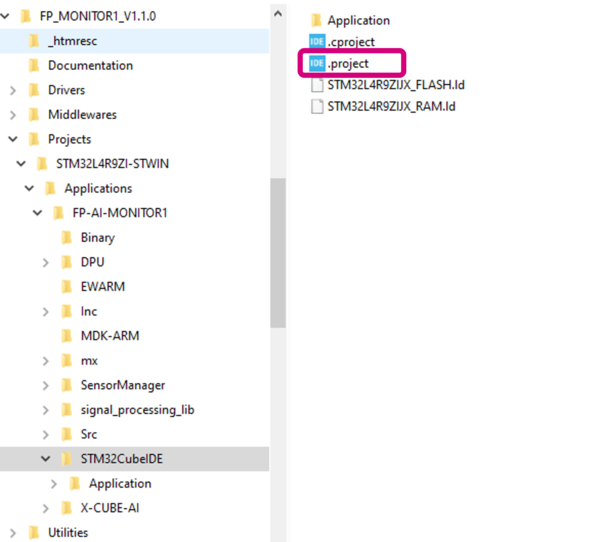
Once these files are copied, the project must be reconstructed and programmed on the sensor board to link the libraries correctly. For this, the user must open the project in STM32CubeIDE located in the /FP-AI-MONITOR1_V1.1.0/Projects/STWINL4R9ZI-STWIN/Applications/FP-AI-MONITOR1/STM32CubeIDE/ folder and double click .project file as shown in the figure below.
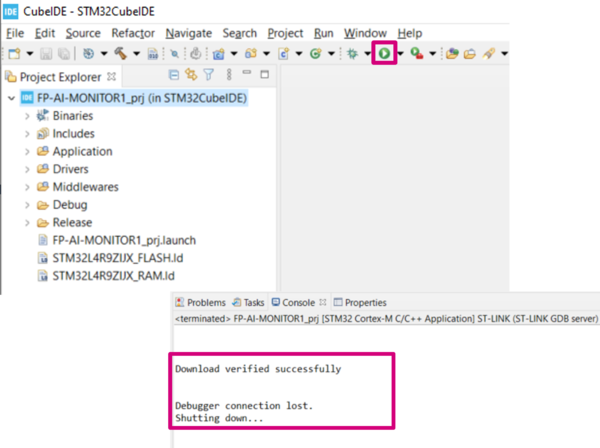
Then build and install the project in STEVAL-STWINKT1B sensor-board by pressing the play button as shown in the figure below.
A message saying Download verified successfully indicates the new firmware is programmed in the sensor-board.
2.4. Testing the NanoEdgeTM AI Machine Learning library
Once the STEVAL-STWINKT1B is programmed with the FW containing a valid library, the condition monitoring libraries are ready to be tested on the sensor board. The libraries can now to used to perform the condition monitoring using the STEVAL-STWINKT1B programmed with FP-AI-MONITOR1.
2.4.1. Connecting the command line interface (CLI) application
FP-AI-MONITOR1 comes with an interactive CLI application. The CLI uses a Virtual COM port over USB to interact with the sensor-board. This section shows how to connect the sensor-board using this and enable the CLI.
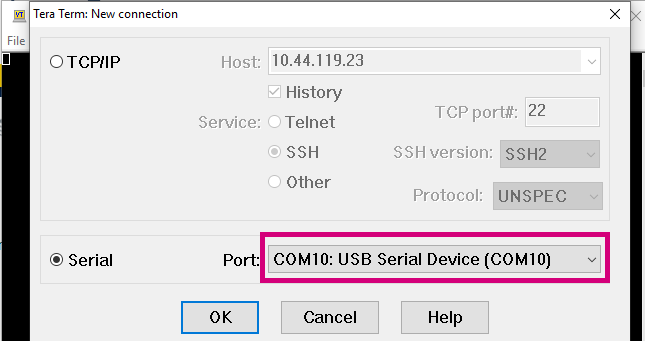
On a windows powered machine start the Tera Term, select the proper connection (featuring the STMicroelectronics name) as shown in the figure below,
Set the parameters:
- Terminal
- [New line]:
- [Receive]: CR
- [Transmit]: CR
- [New line]:
- Serial
- The interactive console can be used with the default values.
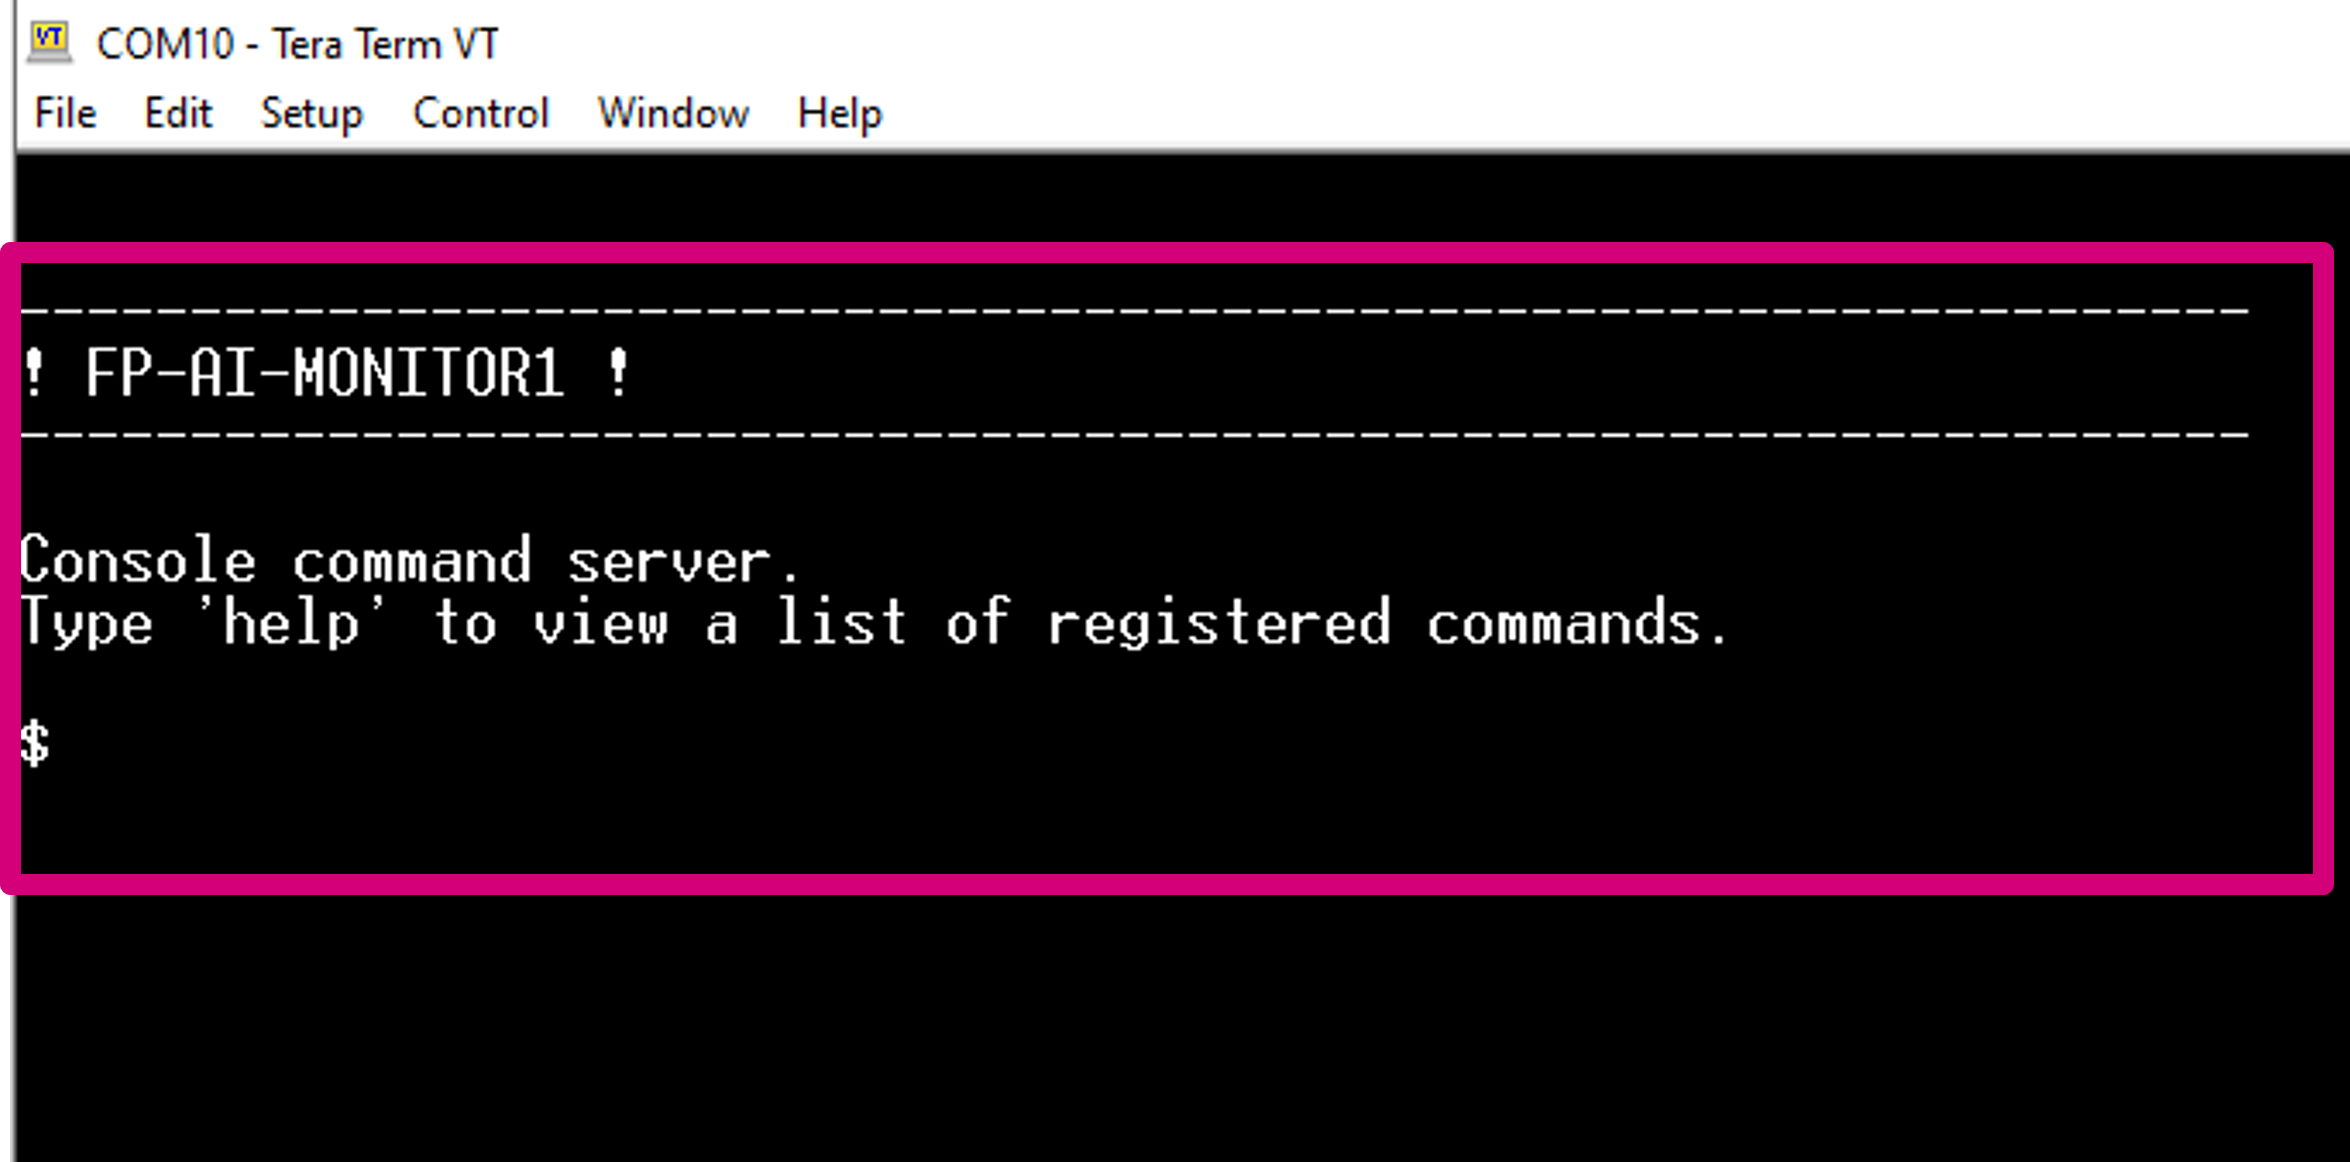
Restart the board by pressing the RESET button. The following welcome screen is displayed on the terminal.
From this point, the users can start entering the commands directly or type help to get the list of available commands along with their usage guidelines.
2.4.2. Learning normal conditions
Once programmed with the newly generated libraries the setup is ready to perform the on-device learning and condition monitoring. To achieve the best performance, the user must perform the learning using the same sensor configurations which were used during the contextual data acquisition. For example in the snippet below users can see commands to configure ISM330DHCX sensor with sensor_id 1 with following parameters:
- enable = 1
- ODR = 1666,
- FS = 4.
$ sensor_set 1 enable 1
sensor 1: enable

$ sensor_set 1 ODR 1666
nominal ODR = 1666.00 Hz, latest measured ODR = 0.00 Hz

$ sensor_set 1 FS 4
sensor FS: 4.00
The learning phase is started by issuing a command $ start neai_learn from the CLI console or by long-pressing the [USR] button. The learning process is reported either by slowly blinking the green LED light on STEVAL-STWINKT1B or in the CLI as shown below:
$ start neai_learn
NanoEdge AI: learn
{"signal": 1, "status": need more signals}
{"signal": 2, "status": need more signals}
:
:
{"signal": 10, "status": need more signals}
{"signal": 11, "status": success}
{"signal": 12, "status": success}
{"signal": 13, "status": success}
:
:
:
End of execution phase
The CLI shows that the learning is to be performed for at least 10 signals and reports that more signals are needed until it has learned 10 signals. After 10 signals are learned, the status message of learning changes to success for every learning of the new signal. The learning can be stopped by pressing the ESC key on the keyboard or simply by pressing the [USR] button.
NOTE: Every library generated from NanoEdgeTM AI Studio comes with some guidelines on how many minimum training samples are to be used to get optimal performance. It is recommended that the user exercises at least three to five times more samples than reported. For example, if the minimum iteration value is 40, the user has to perform learning at each of the three speeds using 120 to 200 samples.
2.4.3. Performing condition monitoring
Once the normal state has been learned, the user can start the condition monitoring process by issuing the command $ start neai_detect command or by double-pressing the [USR] button. This starts the inference phase and checks the similarity of the presented signal with the learned normal signals. If the similarity is less than the set threshold default: 90%, a message is printed in the CLI showing the occurrence of an anomaly along with the similarity of the anomaly signal.
NOTE : This threshold can be changed and set using neai_set threshold <threshold_value> command, where threshold_value can be an integer value between [0 and 100].
Following we perform condition monitoring in different conditions.
2.4.3.1. Running in Normal Conditions
When the fan is running in normal conditions at one of the three speeds no anomalies should be detected i.e. no message should appear in the CLI. This behavior is shown in the snippet below:
NanoEdge AI: starting detect phase.
NanoEdge AI: detect
{"signal": 50, "similarity": 40, "status": anomaly}
{"signal": 51, "similarity": 65, "status": anomaly}
{"signal": 52, "similarity": 80, "status": anomaly}
{"signal": 53, "similarity": 90, "status": anomaly}
{"signal": 80, "similarity": 50, "status": anomaly}
{"signal": 81, "similarity": 75, "status": anomaly}
{"signal": 82, "similarity": 90, "status": anomaly}
{"signal": 130, "similarity": 50, "status": anomaly}
{"signal": 132, "similarity": 75, "status": anomaly}
{"signal": 133, "similarity": 80, "status": anomaly}
{"signal": 134, "similarity": 89, "status": anomaly}
NOTE : The anomalies at the signals shown in the CLI are reported when speeds are changed from one speed to other manually, i.e. accelerating or decelerating. The reason is that in this demo the transients not included in the library generation or learning process. However, when fan is running in stationary conditions i.e. at constant speeds during sequences 1-49, 54-79, 83-129 and 135-onwards, no anomalies are reported.
2.4.3.2. Fan running in Clogged Condition
When fan is clogged (as shown in the figure in data logging section), the anomalies are continuously reported at all the speeds as shown below.
NanoEdge AI: starting detect phase.
NanoEdge AI: detect
{"signal": 1, "similarity": 0, "status": anomaly}
{"signal": 2, "similarity": 0, "status": anomaly}
{"signal": 3, "similarity": 0, "status": anomaly}
:
:
{"signal": 134, "similarity": 0, "status": anomaly}
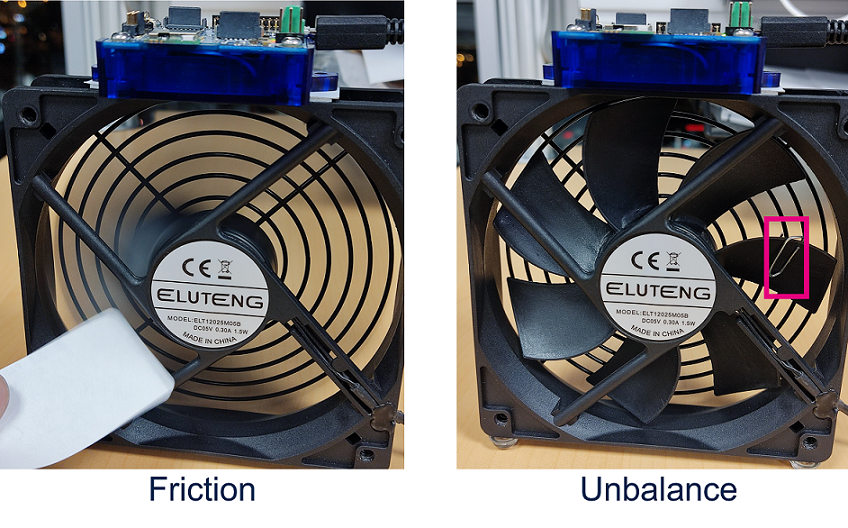
In addition to the clogging anomalies the libraries generated from NanoEdgeTM are capable of detecting almost any other type of faults. Any conditions which is not presented in the learning section is detected as anomaly. For example the conditions for friction or unbalance as shown in the figure below are detected as faults.
NanoEdge AI: starting detect phase.
NanoEdge AI: detect
{"signal": 1, "similarity": 0, "status": anomaly}
{"signal": 2, "similarity": 0, "status": anomaly}
{"signal": 3, "similarity": 0, "status": anomaly}
:
:
{"signal": 60, "similarity": 0, "status": anomaly}
2.4.3.3. Fan Stopped
A very common faulty condition could be that the fan is broken completely and stopped. Although, this condition is not presented in the library generation process, our library is still able to detect this condition.
NanoEdge AI: starting detect phase.
NanoEdge AI: detect
{"signal": 1, "similarity": 0, "status": anomaly}
{"signal": 2, "similarity": 0, "status": anomaly}
{"signal": 3, "similarity": 0, "status": anomaly}
:
:
{"signal": 20, "similarity": 0, "status": anomaly}
However, one might want to add this condition as normal condition and exclude it from the list of anomalies, i.e. if the user wants to stop the fan on purpose and not for the broken conditions. To do this the users can use the incremental learning feature of the NanoEdge AI anomaly detection libraries and simply perform learning while the fan is in stopped condition. After this this condition will be considered as normal and no anomaly will be reported when fan is stopped.
NanoEdge AI: starting detect phase.
NanoEdge AI: detect
NOTE : As the modeling of normal conditions is based on the data used for learning and STEVAL-STWINKT1B is not physically fixed with the fan the slight movements or changes of the orientation might result in bad results for the detecting part. Thanks to the on-device incremental learning capability of the NanoEdgeTM anomaly detection libraries, this problem can be very easily fixed by relearning the new vibration patterns without losing the information learned in the first learning phase. Performing a few relearning with slight changes of the position and orientation of STEVAL-STWINKT1B makes the solution robust and stable.
2.5. Additional parameters in condition monitoring
For user convenience, the CLI application also provides handy options to easily fine-tune the inference and learning processes. The list of all the configurable variables is available by issuing the following command:
$ neai_get all
NanoEdgeAI: signals = 0
NanoEdgeAI: sensitivity = 1.000000
NanoEdgeAI: threshold = 95
NanoEdgeAI: timer = 0
Each of the these parameters is configurable using the neai_set <param> <val> command.
This section provides information on how to use these parameters to control the learning and detection phase. By setting the "signals" and "timer" parameters, the user can control how many signals or for how long the learning and detection is performed (if both parameters are set the learning or detection phase stops whenever the first condition is met). For example, to learn 10 signals, the user issues this command, before starting the learning phase as shown below.
$ neai_set signals 10
NanoEdgeAI: signals set to 10
$ start neai_learn
NanoEdgeAI: starting
$ {"signal": 1, "status": need more signals}
{"signal": 2, "status": need more signals}
{"signal": 3, "status": need more signals}
:
:
{"signal": 10, "status": need more signals}
NanoEdgeAI: stopped
If both of these parameters are set to "0" (default value), the learning and detection phases run indefinitely.
The threshold parameter is used to report any anomalies. For any signal which has similarities below the threshold value, an anomaly is reported. The default threshold value used in the CLI application is 90. Users can change this value by using neai_set threshold <val> command.
Finally, the sensitivity parameter is used as an emphasis parameter. The default value is set to 1. Increasing this sensitivity means that the signal matching is to be performed more strictly, reducing it relaxes the similarity calculation process, meaning resulting in higher matching values.
For further details on how NanoEdgeTM AI libraries and FP-AI-MONITOR1 work users are invited to read the detailed documentation of NanoEdgeTM AI Studio and user manual of FP-AI-MONITOR1.
Following are some resources which can be helpful for the readers.
- FP-AI-MONITOR1: Multi-sensor AI data monitoring framework on wireless industrial node, function pack for STM32Cube
- User Manual: User Manual for FP-AI-MONITOR1
- QSG:Quick Start Guide for FP-AI-MONITOR1
- STEVAL-STWINKT1B
- STM32CubeMX: STM32Cube initialization code generator
- X-CUBE-AI : expansion pack for STM32CubeMX
- NanoEdgeTM AI Studio: NanoEdgeTM AI the first Machine Learning Software, specifically developed to entirely run on microcontrollers.
- DB4345: Data brief for STEVAL-STWINKT1B.
- UM2777: How to use the STEVAL-STWINKT1B SensorTile Wireless Industrial Node for condition monitoring and predictive maintenance applications.
