This article aims to provide a step-by-step guide for the readers to set up a vibration-based condition monitoring solution using an STM32 sensor board. The anomaly detection AI libraries used in this tutorial are generated using Cartesiam NanoEdgeTM AI Studio and the software used to program the sensor board can be downloaded from the ST website.
In this article you learn:
- setting up a motor control project,
- programming the STWIN with FP-AI-NANOEDG1,
- setting-up the sensor node and performing the vibration data logging using vibrometer,
- generating the AI library for condition monitoring,
- integrating the library to FP-AI-NANOEDG1, and programming the sensor-node for condition monitoring, and
- condition monitoring of the motor setup using vibration data.
1. Requirements
To follow and reproduce the steps provided in this article the reader requires the following parts.
1.1. Hardware
The hardware required to reproduce this tutorial includes:
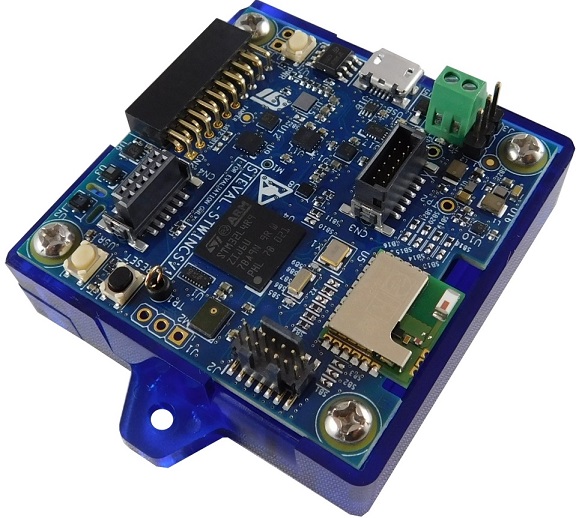
- STEVAL-STWINKT1B
- The STWIN SensorTile wireless industrial node (STEVAL-STWINKT1B) is a development kit and reference design that simplifies prototyping and testing of advanced industrial IoT applications such as condition monitoring and predictive maintenance. For details visit the link.
- STEVAL-STWINKT1B
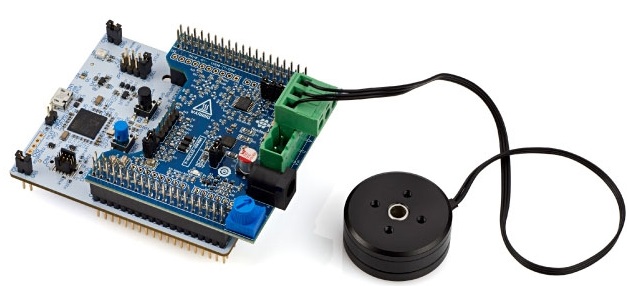
- STM32 P-NUCLEO-IHM03 Motor Control Nucleo Pack
- The P-NUCLEO-IHM03 STM32 motor-control pack is a kit composed of the X-NUCLEO-IHM16M1 board, the NUCLEO-G431RB board, a brushless Gimbal motor (GBM2804H-100T), and the DC power supply. For details visit the link.
- STM32 P-NUCLEO-IHM03 Motor Control Nucleo Pack
- Miscellaneous
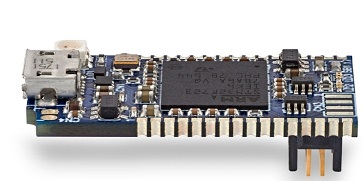
- STLINK-V3MINI to program the STWIN,
- MicroSDTM card formatted as FAT32-FS for the data logging operation,
- A USB MicroSDTM card reader to read the data from the MicroSDTM card to the computer.
- 3 x Micro USB cables to connect the motor control board, STLINK-V3Mini and STWIN
- Plexiglass: to fix the motor, the X-NUCLEO-IHM16M1, and the NUCLEO-G431RB boards.
- 20 cm x 15 cm
- 9 cm x 15 cm
- Magnets and Metallic tape: to attach the STWIN on the motor setup.
- Rubber feet
1.2. Software
- STM32CubeMX 6.0.1
- STM32CubeMX is a graphical tool that allows a very easy configuration of STM32 microcontrollers and microprocessors, as well as the generation of the corresponding initialization C code for the Arm® Cortex®-M core or a partial Linux® Device Tree for Arm® Cortex®-A core, through a step-by-step process. The software can be downloaded from here.
- STM32 Motor Control Software Development Kit 5.4.4.
- STM32 MC SDK (motor control software development kit) firmware (X-CUBE-MCSDK and X-CUBE-MCSDK-FUL) includes the Permanent-magnet synchronous motor (PMSM) firmware library (FOC control) and the STM32 Motor Control Workbench (to configure the FOC firmware library parameters), with its graphical user interface (GUI). For details visit link.
- FP-AI-NANOEDG1 2.0.0
- An Artificial Intelligence (AI) condition monitoring function pack for STM32Cube provides a complete firmware to program an STM32L4+ sensor node for condition monitoring and predictive maintenance applications on the STEVALSTWINKT1B SensorTile wireless industrial node. The function pack can be downloaded from here.
- One of the following IDEs
- STMicroelectronics - STM32CubeIDE version 1.5.1
- IAR Embedded Workbench for Arm (EWARM) toolchain V8.50.5 or later
- RealView Microcontroller Development Kit (MDK-ARM) toolchain V5.31
- STM32CubeMX 6.0.1
- Tera Term
- Tera Term is an open-source and freely available software terminal emulator, which is used to host the CLI of the FP-AI-NANOEDG1 through a serial connection. Users can download and install the latest version available from Tera Term.
- NanoEdgeTM AI Studio 2.0.1
- The function pack is to be powered by Cartesiam. For this, the user needs to generate the libraries from the NanoEdge AI Studio and then embed these libraries in the [1]. The Studio can be downloaded from this https://cartesiam.ai/st-developpement-board-2/. Cartesiam provides a free evaluation version for the STMicroelectronics boards.
- Tera Term
2. Motor set up
2.1. Hardware set up
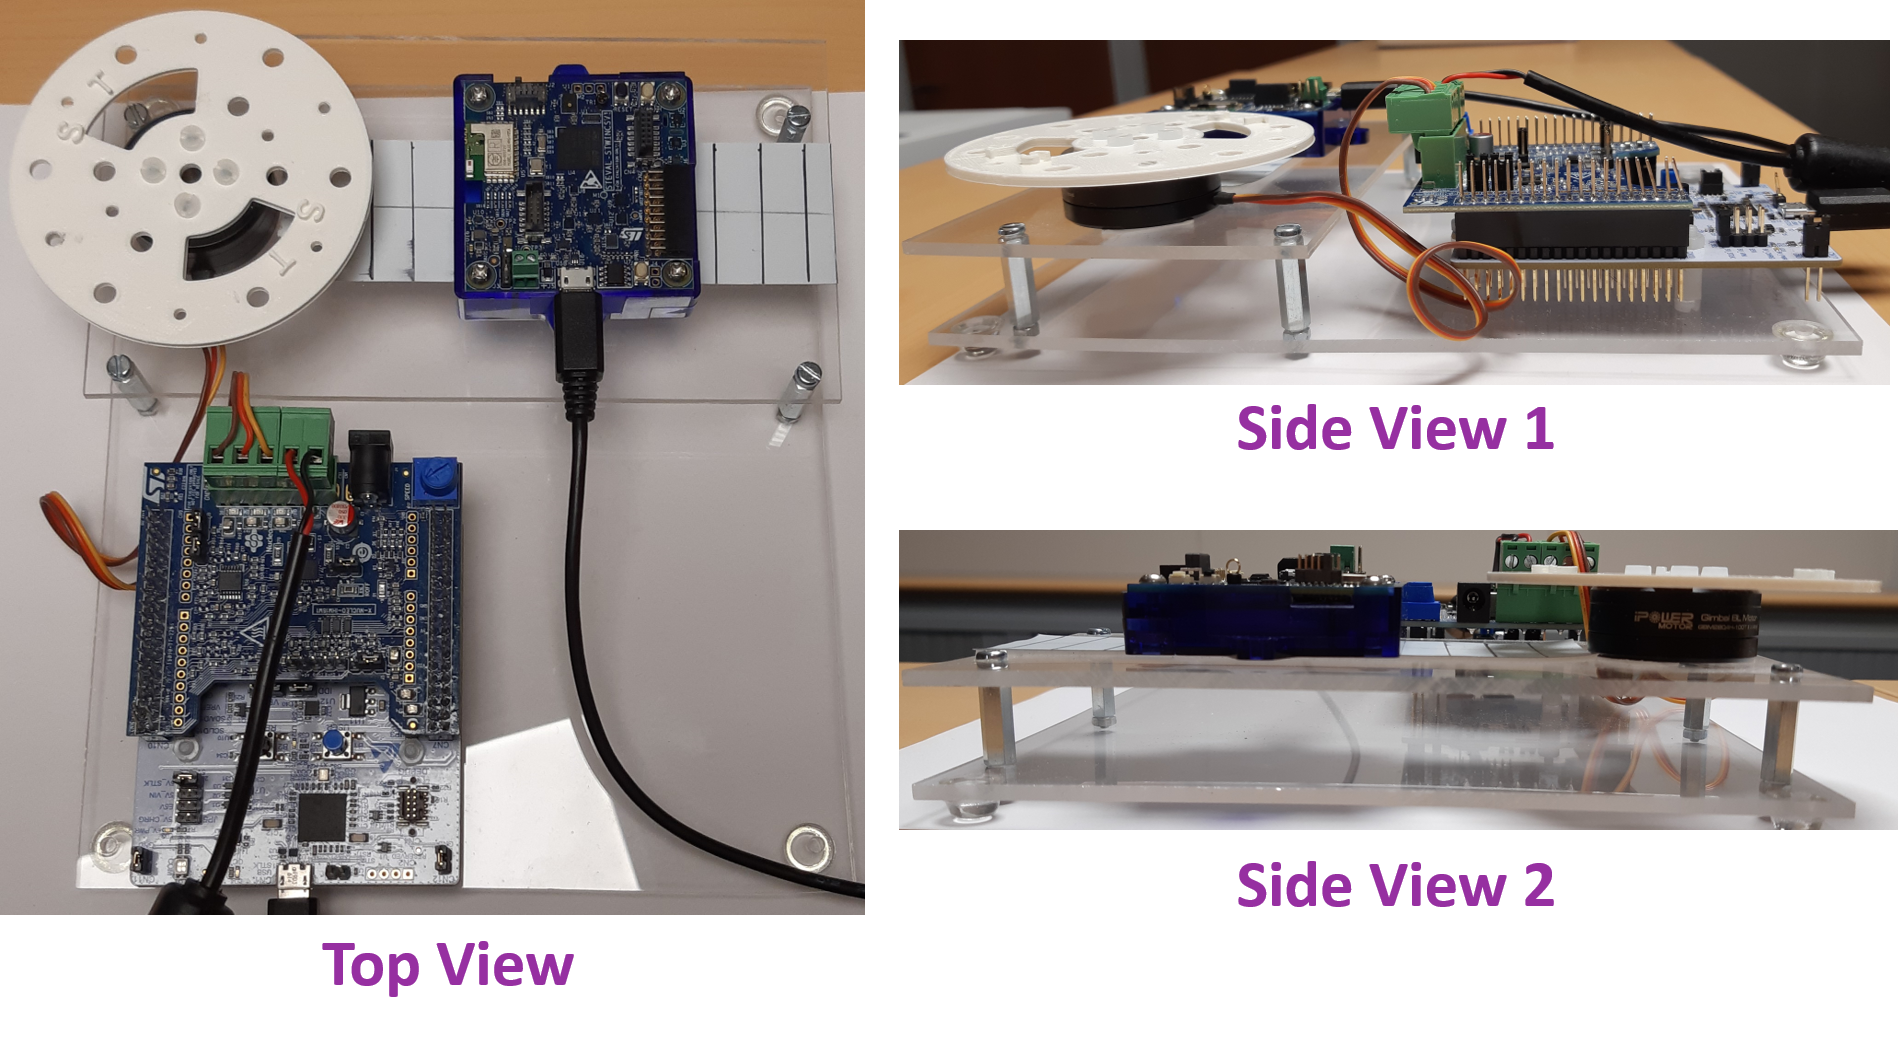
The setup process includes:
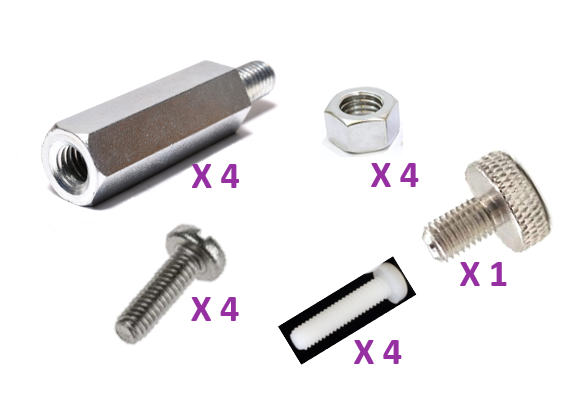
- A two-level plexiglass base, by fixing two plexiglass pieces with the help of the spacer screws.
- Fix the motor using double-sided tape from the left side of the smaller board.
- Fix the G431RB and the IHM16M1 board using the provided screws in the kit with the board. For the electrical connections and jumper configuration please refer to STM32 NUCLEO IHM03 Kit User Manual
- Put the metallic strip in the center of the small board to attach the STWIN to the setup.
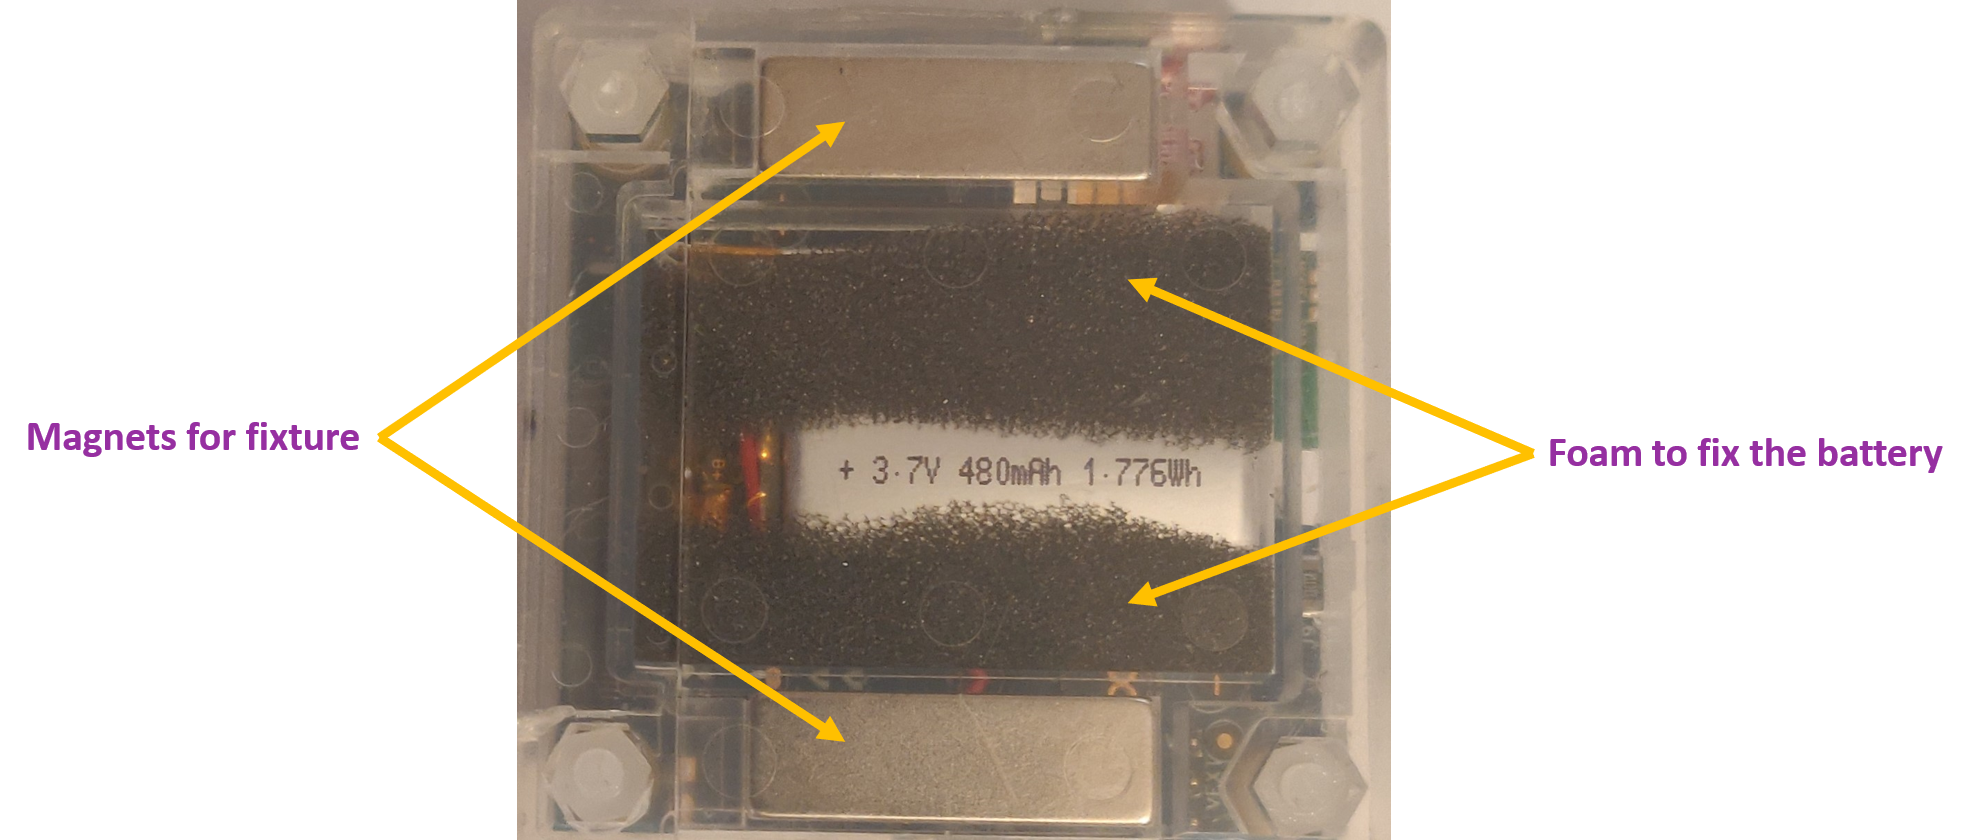
- Insert the magnets in the STWIN plastic case.
2.2. Motor Control Project
For controlling the motor, the motor control project can be created using the STM32 Motor Control Software Development Kit or STM32-MCSDK for short.
2.2.1. Project Definition
In this section, we show the steps to create the project and to program the motor control board with the FW to start, stop, or accelerate and decelerate the motor.
Step 1
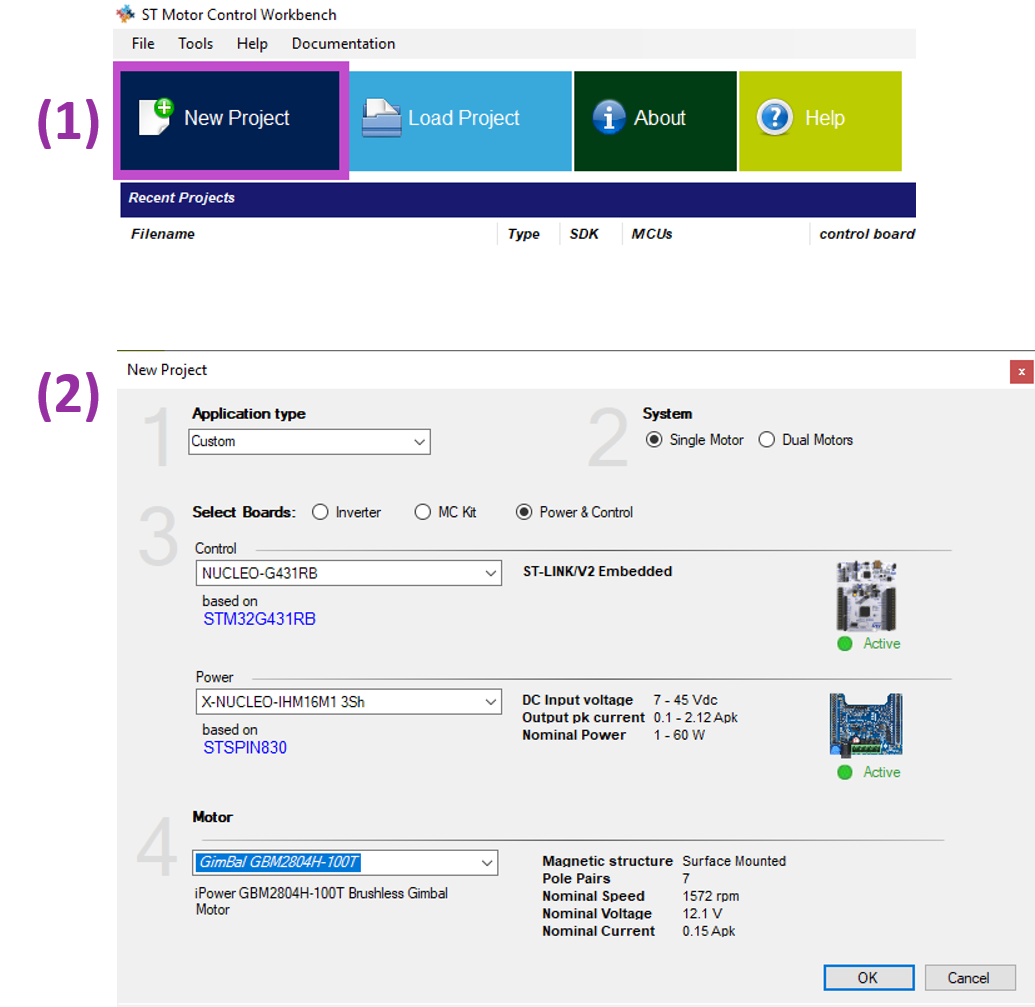
- The first step is to create a new project from the ST Motor Control Workbench. Here we are using version
5.4.4. To start the project click on the New Project icon, this opens a dialog as shown in the figure below.
Step 2
- In the second step define the parameters for your motor control project. For example, for our project, we are defining the following parameters which fit our NUCLEO-IHM03 Board kit.
- Application type: Custom
- System: Single Motor
- Select Boards
- Control: NUCELO-G431RB
- Power: X-NUCLEO_IHM16M1-3Sh
- Motor: GimBal GBM2804H-100T
Step 3
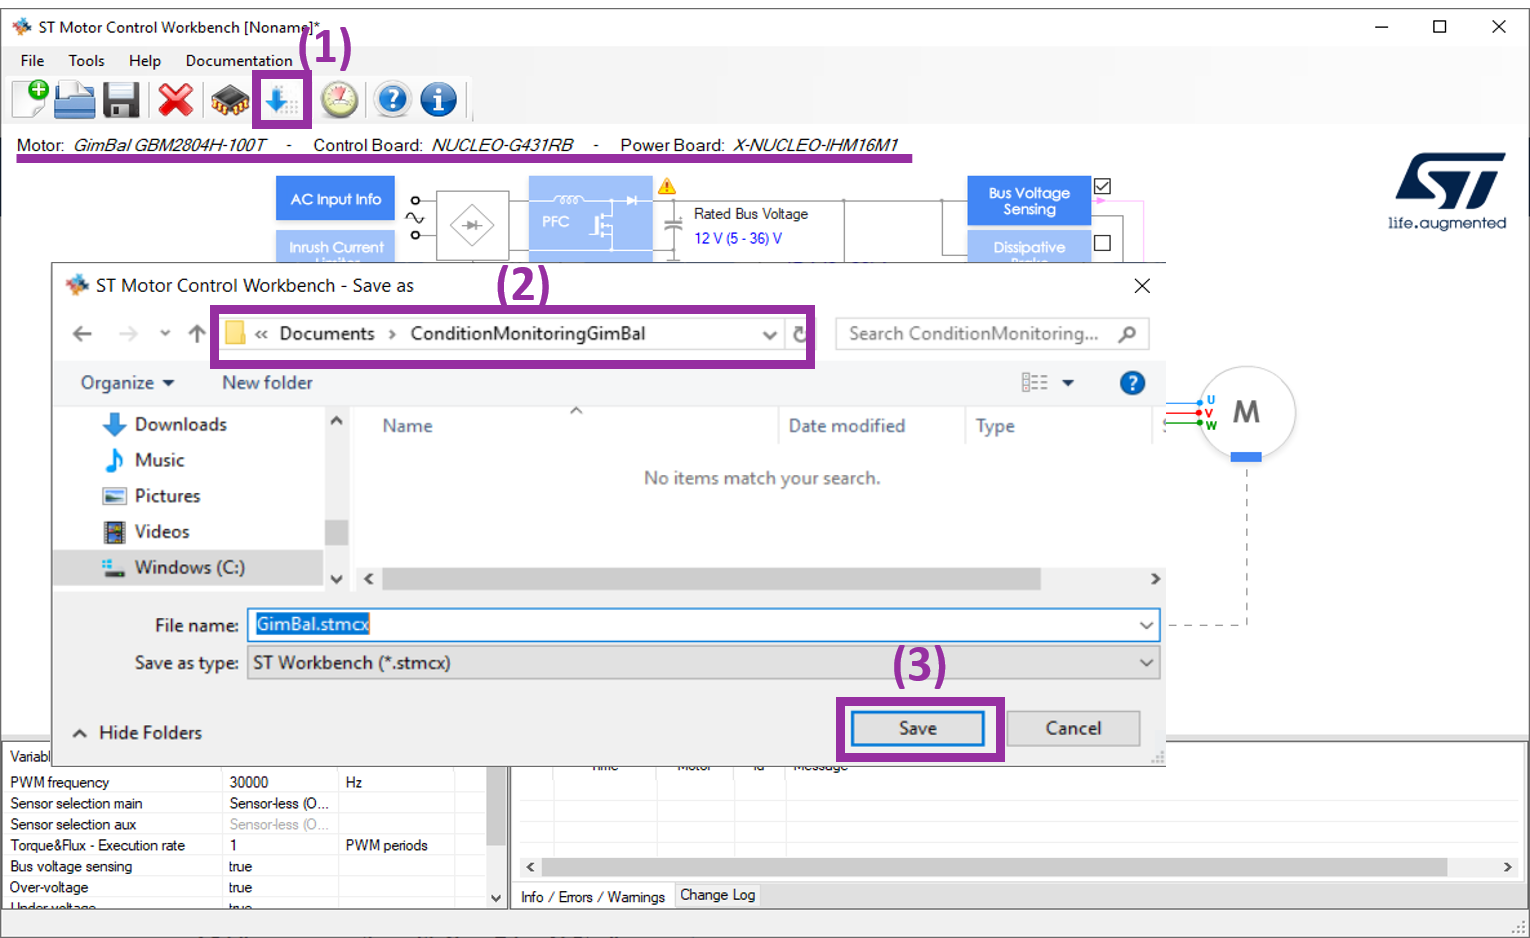
- Once the project is defined, a screen is presented to the reader with the schematic diagram. Here the reader can start the creation of the project and code for the project definition provided in the first step. To start press the download button (1) in the toolbar, and choose a location to save the project definitions as shown in the figure below (2). Once the location is chosen, press the save button (3) to save the definitions. This opens a new dialog for C-code generation.
2.2.2. C-Code Generation for Motor Control Project
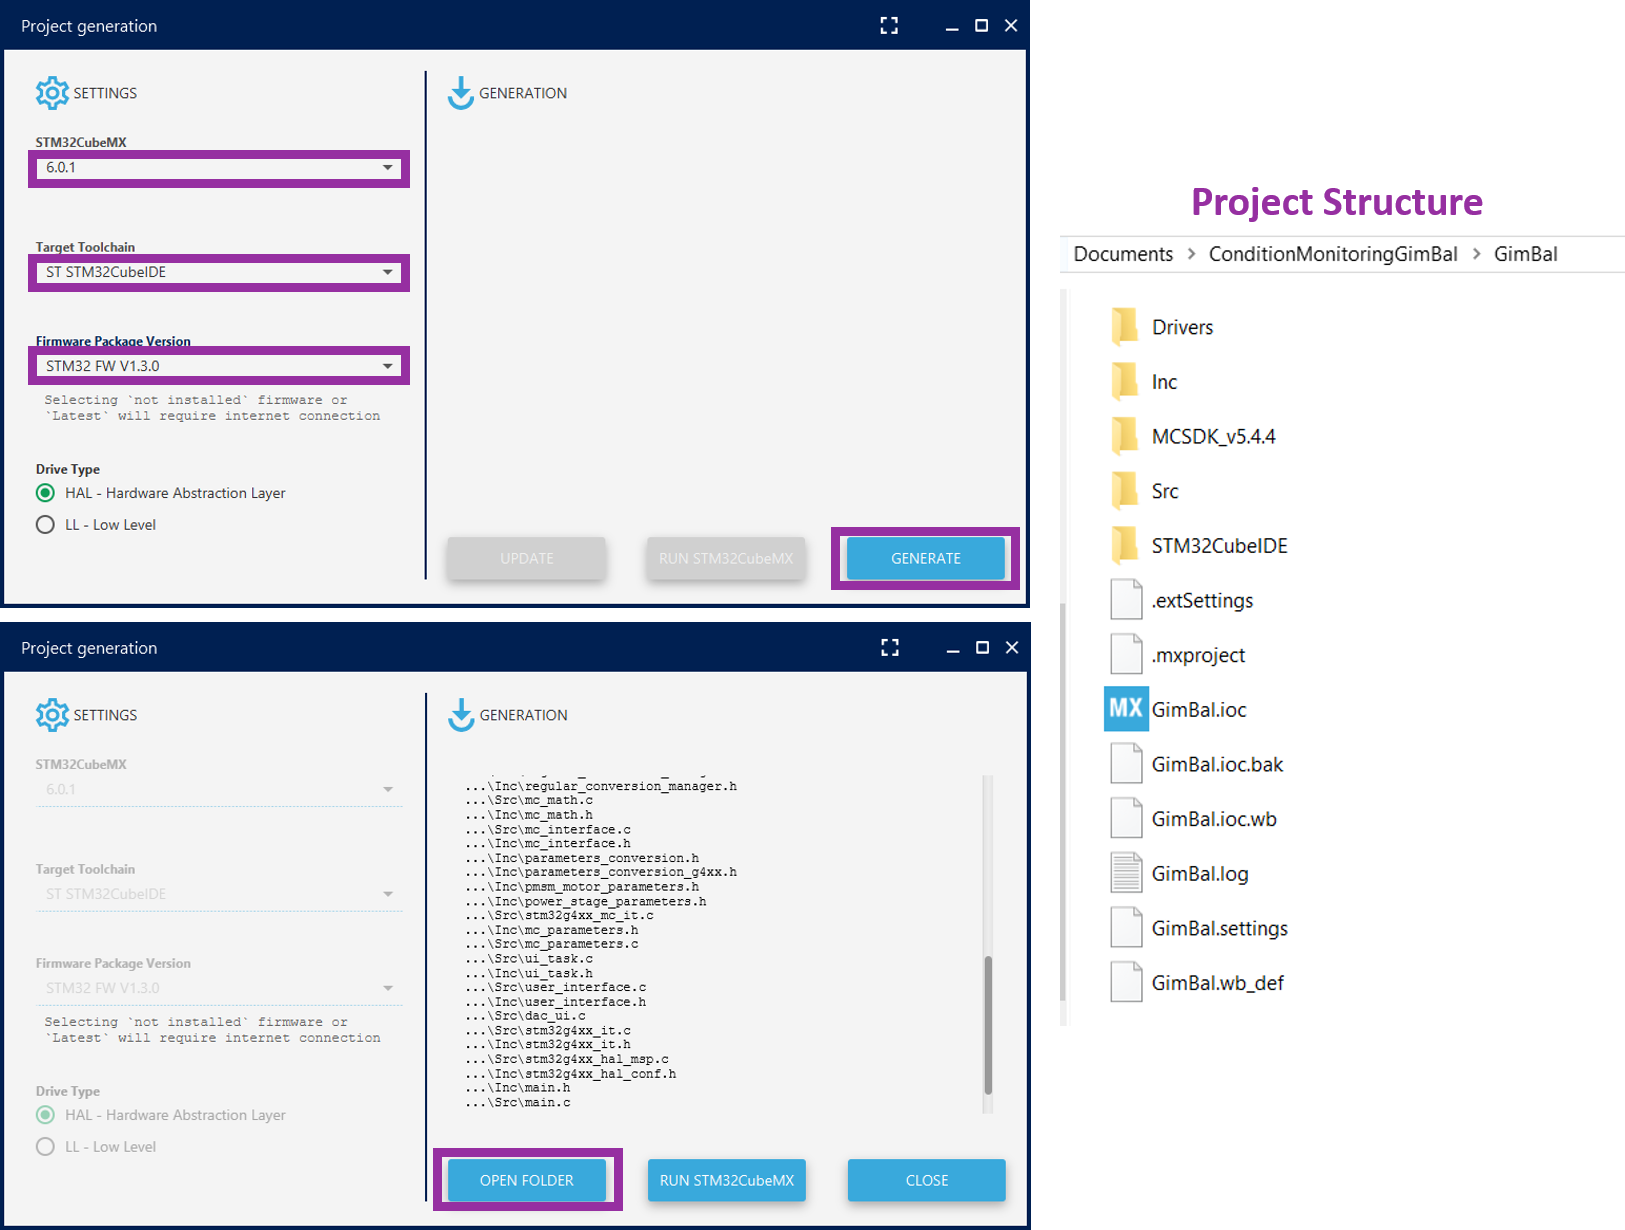
To generate the C-Code for the motor control project the reader is presented with a dialog to define the settings. The figure below shows the settings:
- STM32CubeMX: 6.0.1
- Target ToolChain: ST STM32CubeIDE
- Firmware Package Version: STM32 FW 1.3.0.
and then press the generate button, which starts generating the C-Code in the same directory where the definition of the projects are generated.
Once the C-Code generation process is finished the buttons for the UPDATE and RUN STM32CubeMX are turned Blue from Gray and the text are changed for three buttons too, OPEN FOLDER, RUN STM32CubeMX, and CLOSE respectively. Clicking on the OPEN FOLDER button opens the directory containing the C-Code just generated for the project. The structure and contents of this folder are shown in the figure above.
2.2.3. Programming the G431RB to Control the Motor
After the project is generated the project can be built and the control board can be programmed using STM32CubeIDE a free eclipse-based IDE for STM32 boards. This section explains how to load this project in CubeIDE and then build and flash it to the board.
The project can be imported in the CubeIDE following the steps shown in the figure below.
Step 1: Open the CubeIDE and click on the File menu in the Toolbar. From the list select the option for Open Projects from File System.
Step 2: Click on the directory button and navigate to the folder containing the C-code created in the section above as shown in the image.
Step 3: Go to /GimBal/STM32CubeIDE/ directory.
Step 4: Once in the right directory click the Select Folder button to close the opened dialog.
Step 5: Press the Finish Button to finish the importing process of the project in the STM32CubeIDE.
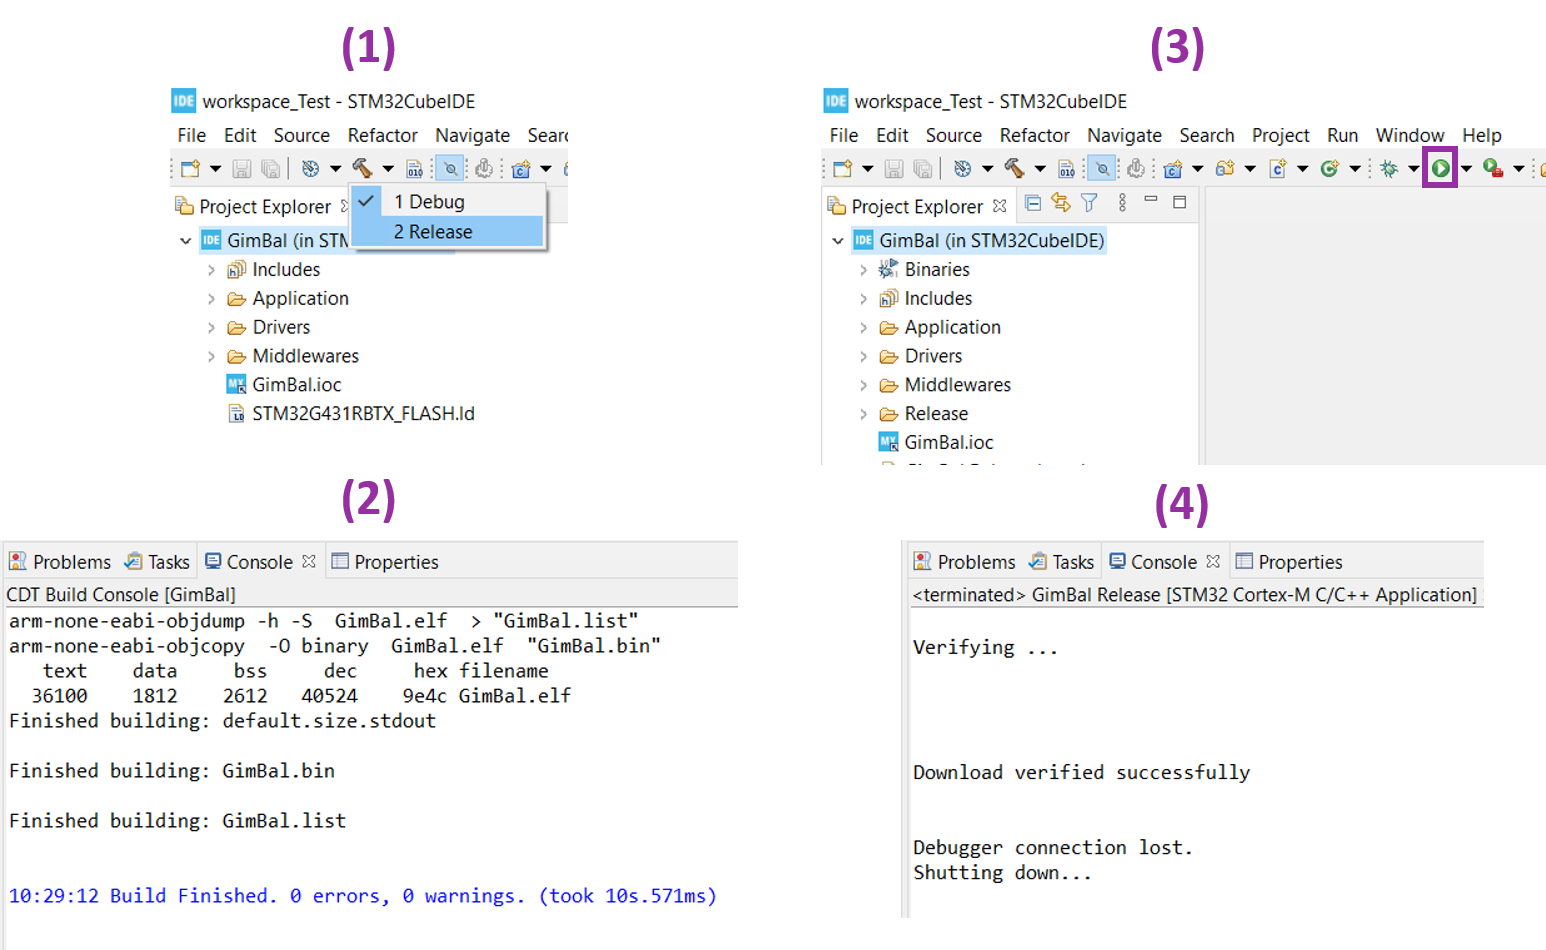
Once the project is imported in STM32CubeIDE the next step is to compile and install the project. The steps to compile and program are shown in the figure below.
Click on the dropdown arrow next to the Hammer icon and select Release mode for building (1). Once the project is successfully built, the Console shows a message indicating the Build Finished. 0 errors, 0 warnings. (took XYs.XYZms), as shown in the figure above (2).
After the Build process is complete, connect the motor control board to the computer, and flash the binary of the project by simply pressing the Play button as shown in the figure step (3). Once the board is successfully programmed the console shows a message Download verified successfully as shown in step (4). This will also disconnect the debugger.
2.3. Controlling the motor
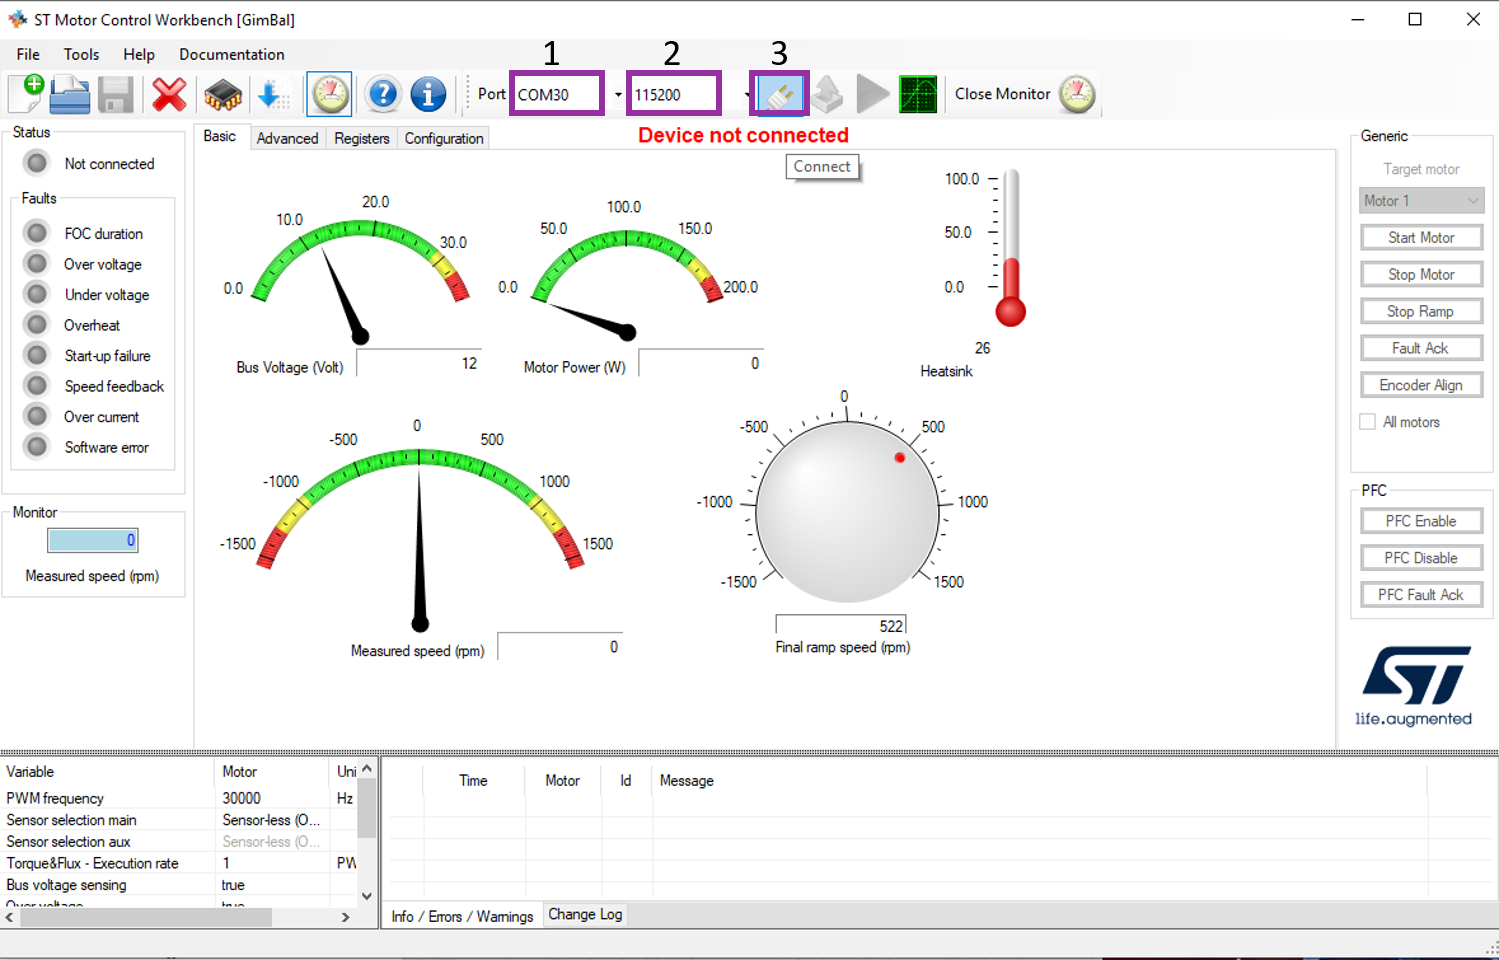
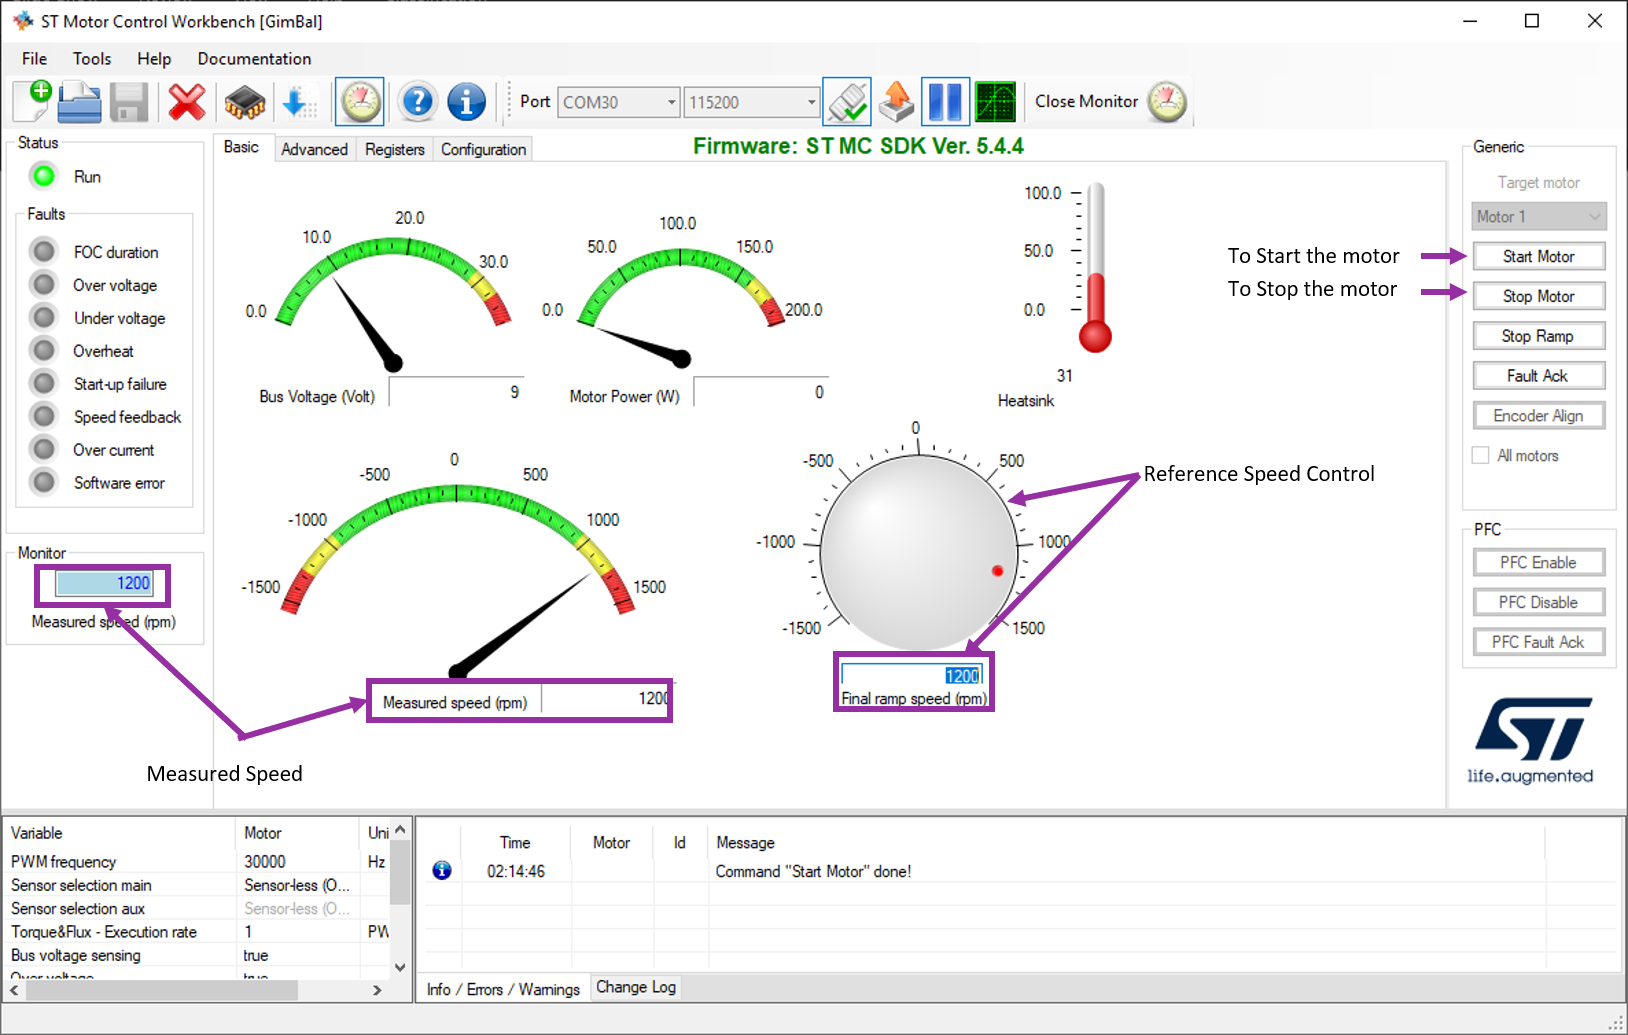
Once the control board is programmed with the project, the motor is ready to be run. Clicking on the meter icon opens the motor monitor as shown in the figure below.
Once the right connection parameters are chosen the connection to the motor can be established by pressing the plug button. The steps to connection are:
- Choice of port: Port 30 (in our case)
- Baud Rate: 115200
- Press the connect button.
Once connected the connect icon changes to a connection and tick icon as shown in the figure below. Now the motor can be started by pressing the start button and stopped by pressing the stop button as shown in the right pan of the figure below. By default, the motor is set to be started at 522 RPM, but the speed of the motor can be changed either by rotating the knob or by entering it manually in the text box below the knob. While the motor is running the current/measured speed is also shown in the two places in the monitor as shown in the figure below, for example under the speed meter in the main panel and the left panel under the monitor.
3. Sensor Node Setup
3.1. Get the function pack
This section presents a brief part about setting up the sensor-node with FP-AI-NANOEDG1, and the complete documentation on how to use the FP-AI-NANOEDG1 with STWIN1KTB can be found as Quick Start Guide and User Manual.
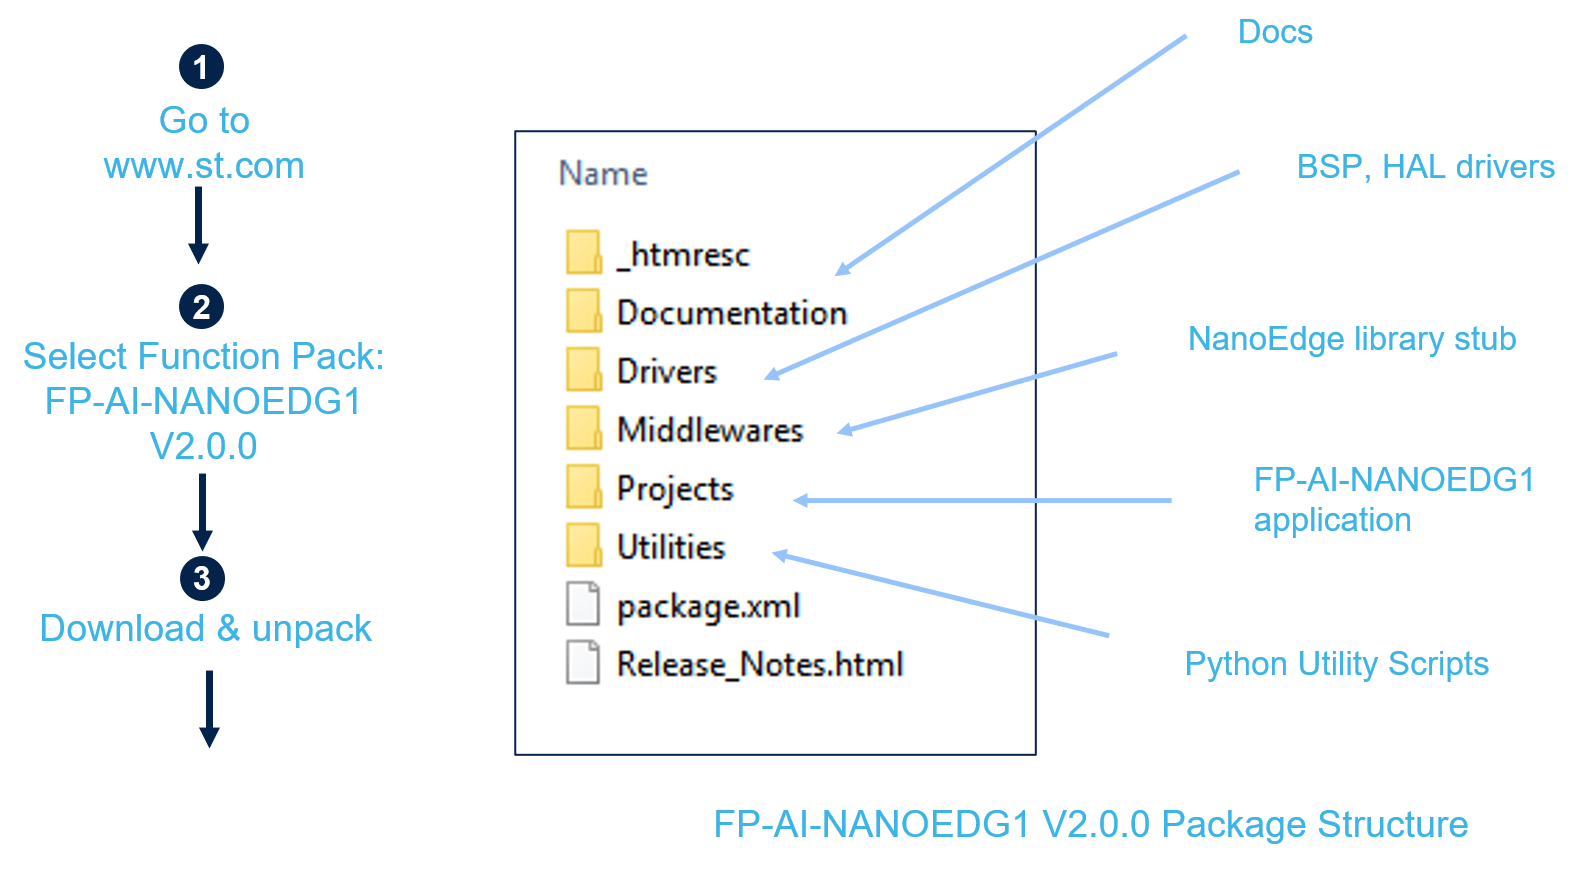
The FP-AI-NANOEDG1 can be downloaded from ST website. Once the pack is downloaded, the user can unpack/unzip it and copy the contents to a folder on the PC. The steps of the process along with the contents of the folder are shown in the following image.
3.2. Flashing the application on the sensor board STEVAL-STWINKT1B
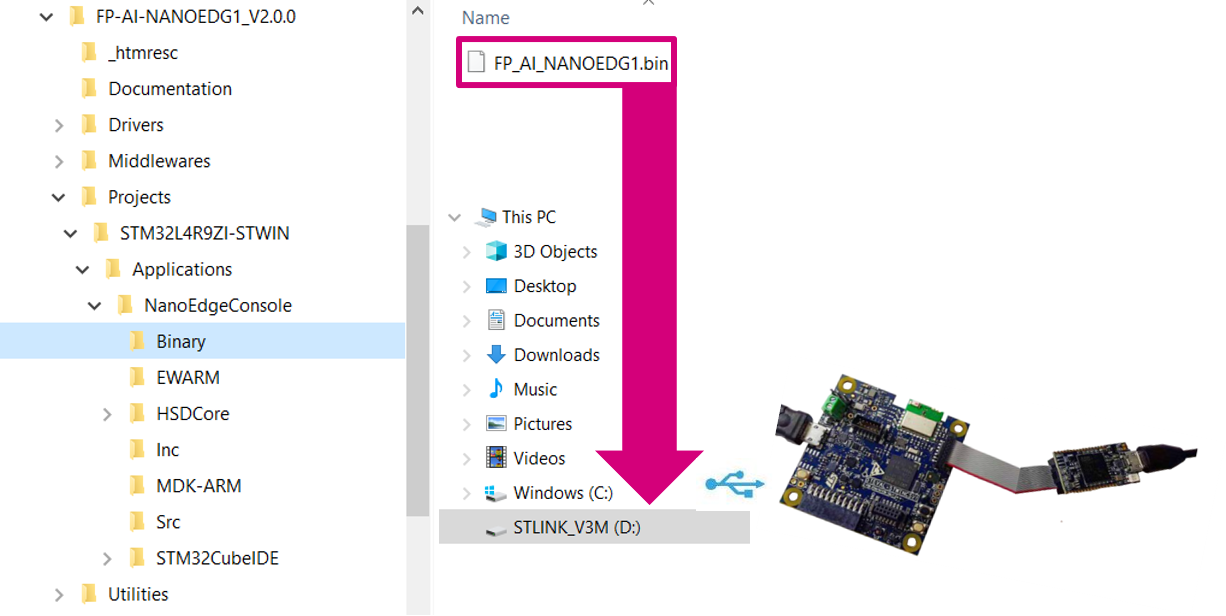
For the convenience of the users, the function pack is equipped with a pre-built binary file of the project. The sensor-board can be programmed with the provided binary by a simple drag-and-drop operation as in the figure below.
3.3. Setting up the Console
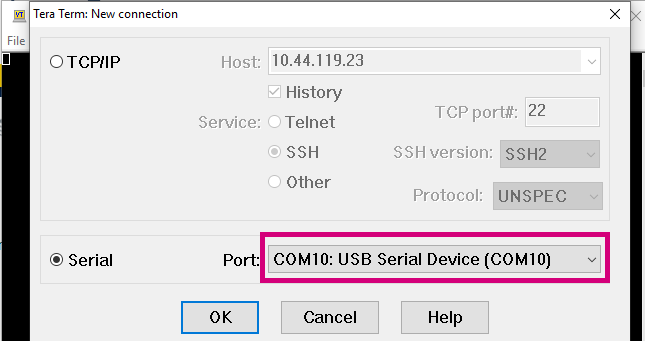
To set up the serial connection between the board and the PC through the Tera Term, start Tera Term, and create a new connection, select the proper port. In the figure below, this is COM10 - USB Serial Device (COM 10).
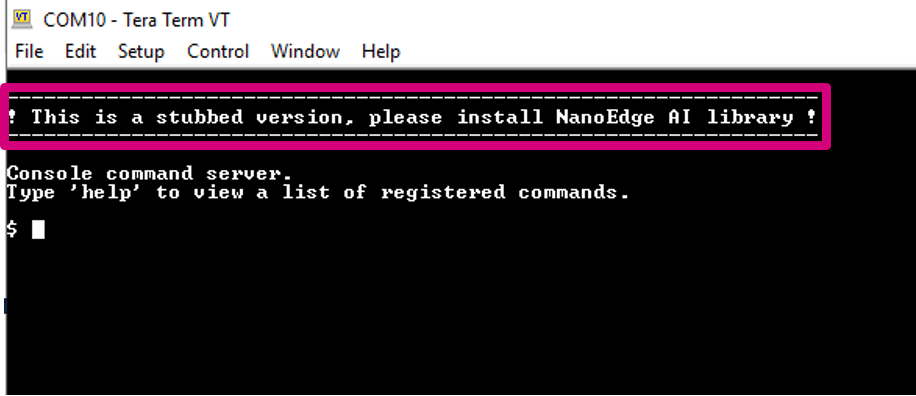
A successful connection shows a message like below. If this message does not appear, the user can try to reset the board.
Typing help shows the list of all available commands.
4. Condition Monitoring using an AI library generated with NanoEdgeTM AI Studio
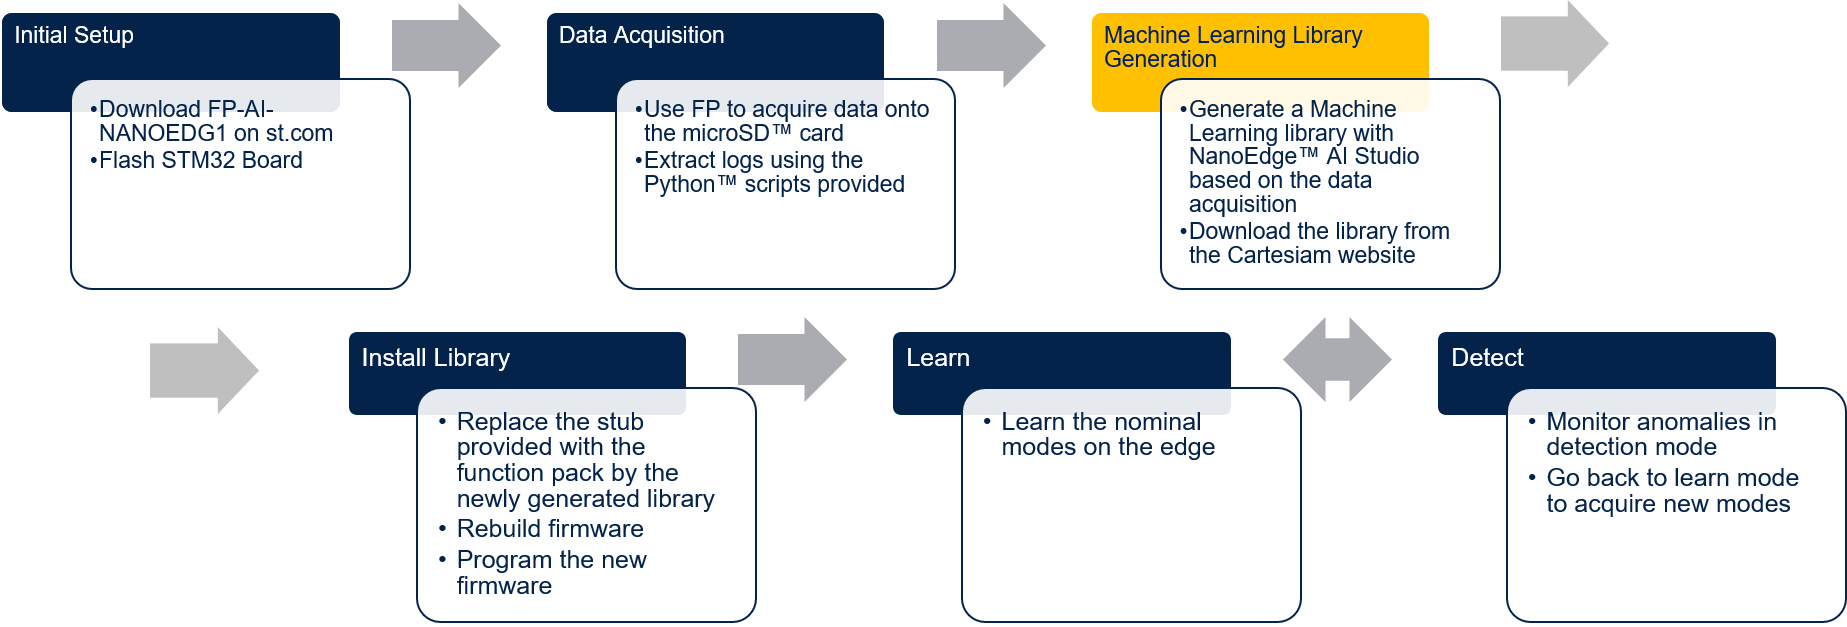
The process of condition monitoring using FP-AI-NANOEDG1 is described in the following diagram.
4.1. Generating a Condition Monitoring Library
In this section, we perform the steps to generate a condition monitoring library with the help of NanoEdgeTM AI Studio to monitor the motor running in a balanced condition.
Assumptions:
- In normal conditions, the motor should run at one of the three speeds [1000, 1250, 1500] RPM.
- Motor running in unbalanced condition (unbalance introduced with a weight, for example, a screw in the disc) or motor stopped or impacts or taps on the motor platform base are abnormalities and should be detected when running the condition monitoring phase.
4.1.1. Contextual Datalogging
NanoEdgeTM AI Studio requires the user to provide some contextual data to provide the best libraries which fit the setup of the user to be monitored. This data is not used for the learning of the libraries but just the initialization and choosing of the library from a big pool of available solutions. This section describes the process of the sample data acquisition for normal and abnormal conditions.
4.1.1.1. Configure the sensor for data logging
Through the CLI interface, a user can configure the supported sensors on the sensor-board and can log the data with these sensors. In the ISM330DHCX sensor, there are multiple sub-sensors to log acceleration and gyrometer data. These sub-sensors can be individually configured. The configurable options for these sensors and sub sensors include:
- Activate/deactivate the sensor or a sub-sensor,
- Set an output data rate (ODR) from the list of available options,
- Set full-scale range from the list of available options.
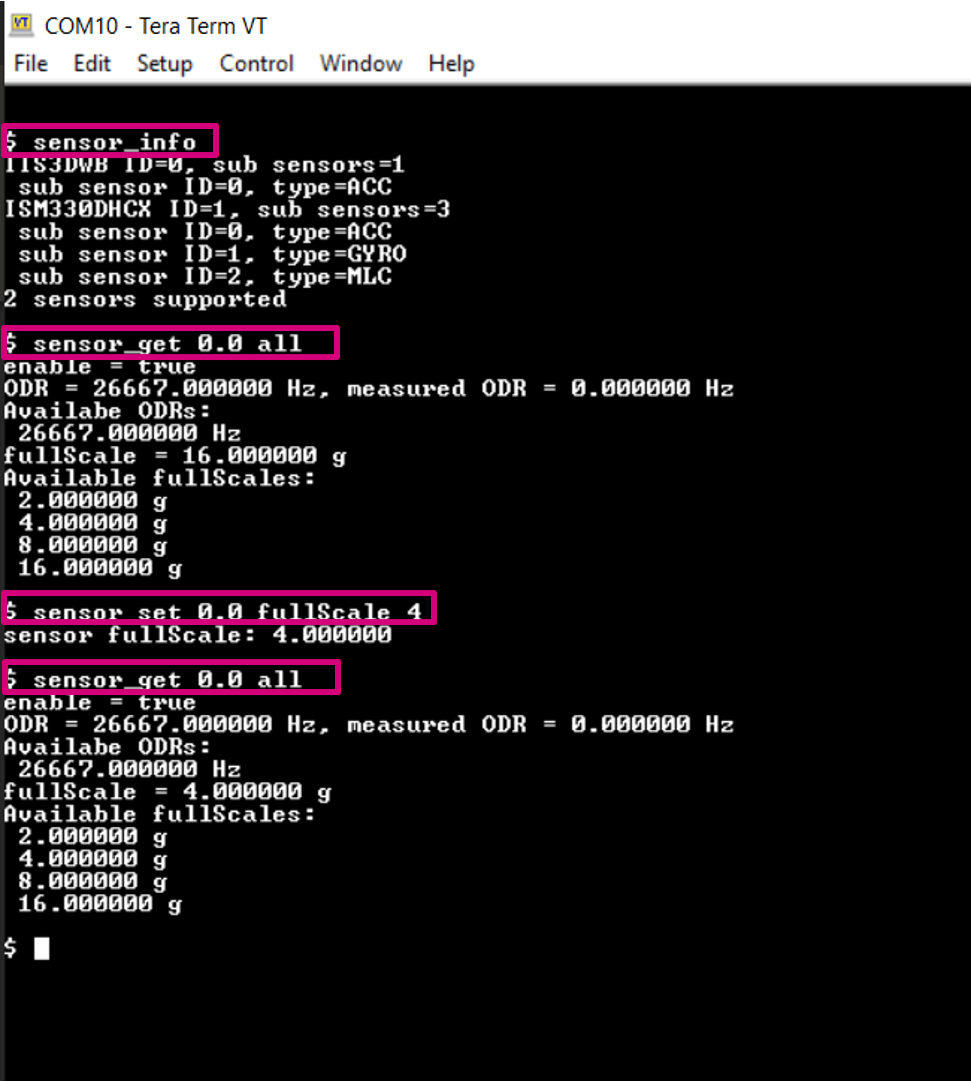
The list of all the supported sensors and sub-sensors can be displayed on the CLI console by entering the command:
$ sensor_info
This command prints the ids for the supported sensors with sub-sensors. The detailed information of a given supported sensor or sub-sensor can be shown by typing command:
$ sensor_get <sensor_id.sub-sensor_id> all
Similarly, the values for any of the available configurable parameters can be set through command
$ sensor_set <sensor_id.sub-sensor_id> <param> <val>
In this article, we use the IIS3DWB sensor which is a high bandwidth accelerometer capable of logging the data at ODR (output data rate) of 26.6 kHz, but readers can perform the same procedure with the other sensor ISM330DHCX too, at their desired ODR (one of the supported ODRs).
The first step is to configure the sensor. To do so, the user has to reset the sensor-board and set up the sensor IIS3DWB. This can be done by executing the following commands.
$ reset
-----------------------------------------------------------------
! This is a stubbed version, please install the NanoEdge AI library!
-----------------------------------------------------------------
Console command server.
Type 'help' to view a list of registered commands.

$ sensor_set 0.0 enable 1
sensor 0.0: enable

$ sensor_set 0.0 fullScale 4
sensor fullScale: 4.000000

$ sensor_get 0.0 all
enable = true
ODR = 26667.000000 Hz, measured ODR = 0.000000 Hz
Availabe ODRs:
 26667.000000 Hz
fullScale = 4.000000 g
Available fullScales:
 2.000000 g
 4.000000 g
 8.000000 g
 16.000000 g
$
4.1.1.2. Normal Data Logging
The NanoEdgeTM AI Studio requires the user to provide the contextual data for both normal and abnormal conditions. In this section, we record the normal data for the motor at three different speeds 1000, 1250, and 1500 RPM. NanoEdgeTM AI Studio requires only contextual data, we do not need much data. CLI application for the FP-AI-NANOEDG1 also provides the option of the timed datalog. In this example, we acquire data for just 4 seconds for each condition. To perform a timed datalog, the reader needs to set the datalog timer. The timer values can be set and displayed as presented below.
$ datalog_set timer 4000
datalog: timer set to 4000 ms

$ datalog_get timer
data log: timer = 4000 ms
$
The data log can be performed as below:
- Run the motor and set the Sensor_board on the motor base as shown in the figure of motor setup in section 2.
- Change the speed of the motor to the required speed.
start datalog- Wait for the datalog to stop and
$ datalog: stoppedmessage. - Repeat from steps 2 to 4 until all the three speeds are recorded.
4.1.1.3. Abnormal Data Logging
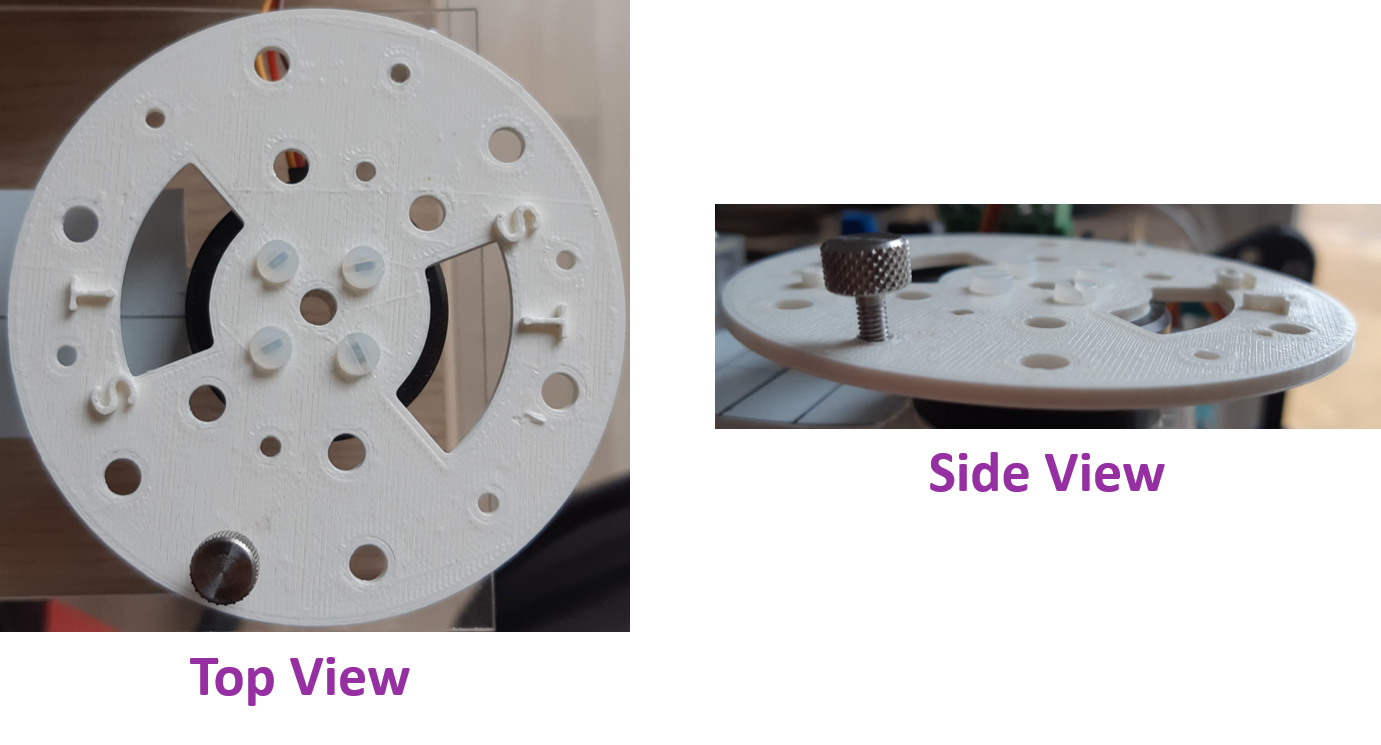
For abnormal data, we make the data logging while the motor is running in unbalanced conditions at the same three speeds as normal data. The unbalanced conditions are simulated by installing a screw on the disc as shown in the figure below.
Log the data for the three speeds for unbalanced conditions following the same steps described in the section above.
4.1.2. Data Preparation for NanoEdgeTM AI Studio
The data logging in section 4.1.1. generates six data logging folders named as STM32_DL_00X where X keeps on incrementing for every new datalog. To use these datalogs for the generation of the NanoEdge AI library, the data needs to be prepared and processed in a defined way to generate the normal and abnormal data files for NanoEdgeTM AI Studio.
To facilitate users, FP-AI-NANOEDG1 provides sample code examples and datasets for the GimBal motor at the aforementioned three speeds. The Python code examples along with the data can be found at the path /FP-AI-NANOEDG1_V2.0.0/Utilities/AI_resources/Datalog/. The codes are provided as a Jupyter Notebook named as FP-AI-NANOEDG1-HSD-Utilities.ipynb and the sample datasets are in the subdirectory ./Sample-DataLogs/. These scripts expect the reader to arrange the data as below. As the first three logs correspond to data for three speeds in normal condition, these are grouped into balanced folder and the other three are grouped under unbalanced. Both the normal and abnormal data are placed in a single folder named GimBalData. The details are shown in the figure below.
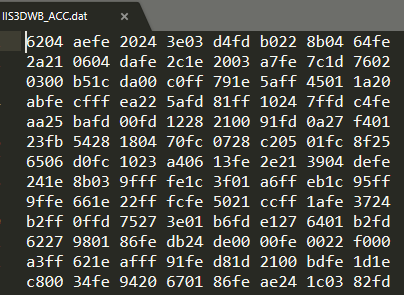
Each of the data logging folders contains three files, AcquisitionInfo.json, DeviceConfig.json, and IIS3DWB_ACC.dat respectively. These files contain the details of the acquisition info, the sensor configurations, and binary formatted data for the sensor IIS3DWB, respectively. The data as shown in the figure below is in the form of binary and is not useable as it is.
To process and shape the data in NanoEdge AI compliant format, Python utility code is provided in the form of a Jupyter Notebook in FP-AI-NANOEDG1. The following section details, the process of generating human-readable CSV files for each of the acquisitions as well as creating segments of the data and reshaping them to provide to NanoEdgeTM AI Studio.
4.1.2.1. Parsing the .dat files into CSV files
The Jupyter Notebook /FP-AI-NANOEDG1_V2.0.0UtilitiesAI_resourcesDataLog/FP-AI-NANOEDG1-HSD-Utilities.ipynb contains all the required code for the data manipulation for this article. The reader just has to run section 3, named Playing with actual data for PdM to generate NEAI libraries.
To use this python script to prepare the data for the GimBal monitoring the user needs to copy the data folder GimBalData created using the instructions provided in the above section, at the path FP-AI-NANOEDG1_V2.0.0UtilitiesAI_resourcesDataLog/Sample-DataLogs/GimBalData/.
Once the data is copied, the user can modify the variable called dataFolder and put the relative path to the data folder as, dataFolder = ./Samples-DataLogs/GimBalData/. Running this section generates the CSV files for all the six data logs. Each folder now contains a .csv file named as IIS3DWB_ACC.csv.
# 3.1 Parsing the data for all speeds and conditions
import Utilities_FP_AI_NanoEdgeAi as UNEAI
dataFolder = './Sample-DataLogs/IIS3DWB/' # to be replaced with the new data folder
conditions = [ 'balanced', 'unbalanced' ]
speeds = [ 1000, 1250, 1500 ]
sensorName = 'IIS3DWB'
for cdn in conditions:
    for spd in speeds:
        UNEAI.DataParser('{}{}/{}RPM/'.format( dataFolder, cdn, spd ), sensorName = sensorName )
4.1.2.2. Creating the Segments for normal and abnormal data for NanoEdgeTM AI Studio
Once the CSV files are generated for all the data acquisitions the next step is to form the data segments to present as normal and abnormal data to NanoEdgeTM AI Studio. To model the normal and abnormal behavior of the system, we can not just use one sample as it is too short and impulsive, but we want to model the behavior over a window or frame of the samples. Similarly, using too long a sequence length result in long delays and non-real-time behavior. To find a compromise in this demo we are using a sequence length of 1024 samples.
NanoEdgeTM AI Studio expects the data of a sequence or frame to be vectorized in the following order.
To do so, the reader can simply use the code provided in section 3.2 of the Jupyter notebook. All that is required is to change the name of the normal and abnormal data directories, in the line as shown in the snippet below.
seqLength = 1024 # length of the segments
seqStep = 1024 # controls the overlap
dataDir = './Sample-DataLogs/IIS3DWB/'    # replace it with dataDir = './Sample-DataLogs/GimBalData/'
normalDataFileName = 'normalSegments.csv'
abnormalDataFileName = 'abnormalSegments.csv'
sensorName = 'IIS3DWB' # change it to the sensor name you are using ISM330DHCX
normalDataDir = dataDir + 'balanced/'
abnormalDataDir =  dataDir + 'unbalanced/'
subSensorName = sensorName + '_ACC' # change _ACC with _GYR if using Gyro sensor instead of Acc

normalDataSeqs, abnormalDataSeqs = UNEAI.PrepareCSVs( normalDataDir = normalDataDir, abnormalDataDir = abnormalDataDir,
                                                     sensorName = sensorName, frameLength = seqLength, seqStep = seqStep,
                                                     normalDataFileName = normalDataFileName, abnormalDataFileName = abnormalDataFileName)
print('Files have been prepared with following details.')
print('Number of normal samples : ', normalDataSeqs.shape[0])
print('Number of abnormal samples : ', abnormalDataSeqs.shape[0])
Running this section generates two csv files named as normalSegments.csv and abnormalSegments.csv containing frames for normal and abnormal data, at the path /FP-AI-NANOEDG1_V2.0.0/Utilities/AI_resources/Datalog/.
In the next section, we explain how to use these files to generate the AI libraries from NanoEdgeTM AI Studio.
4.1.3. Library generation with NanoEdgeTM AI Studio
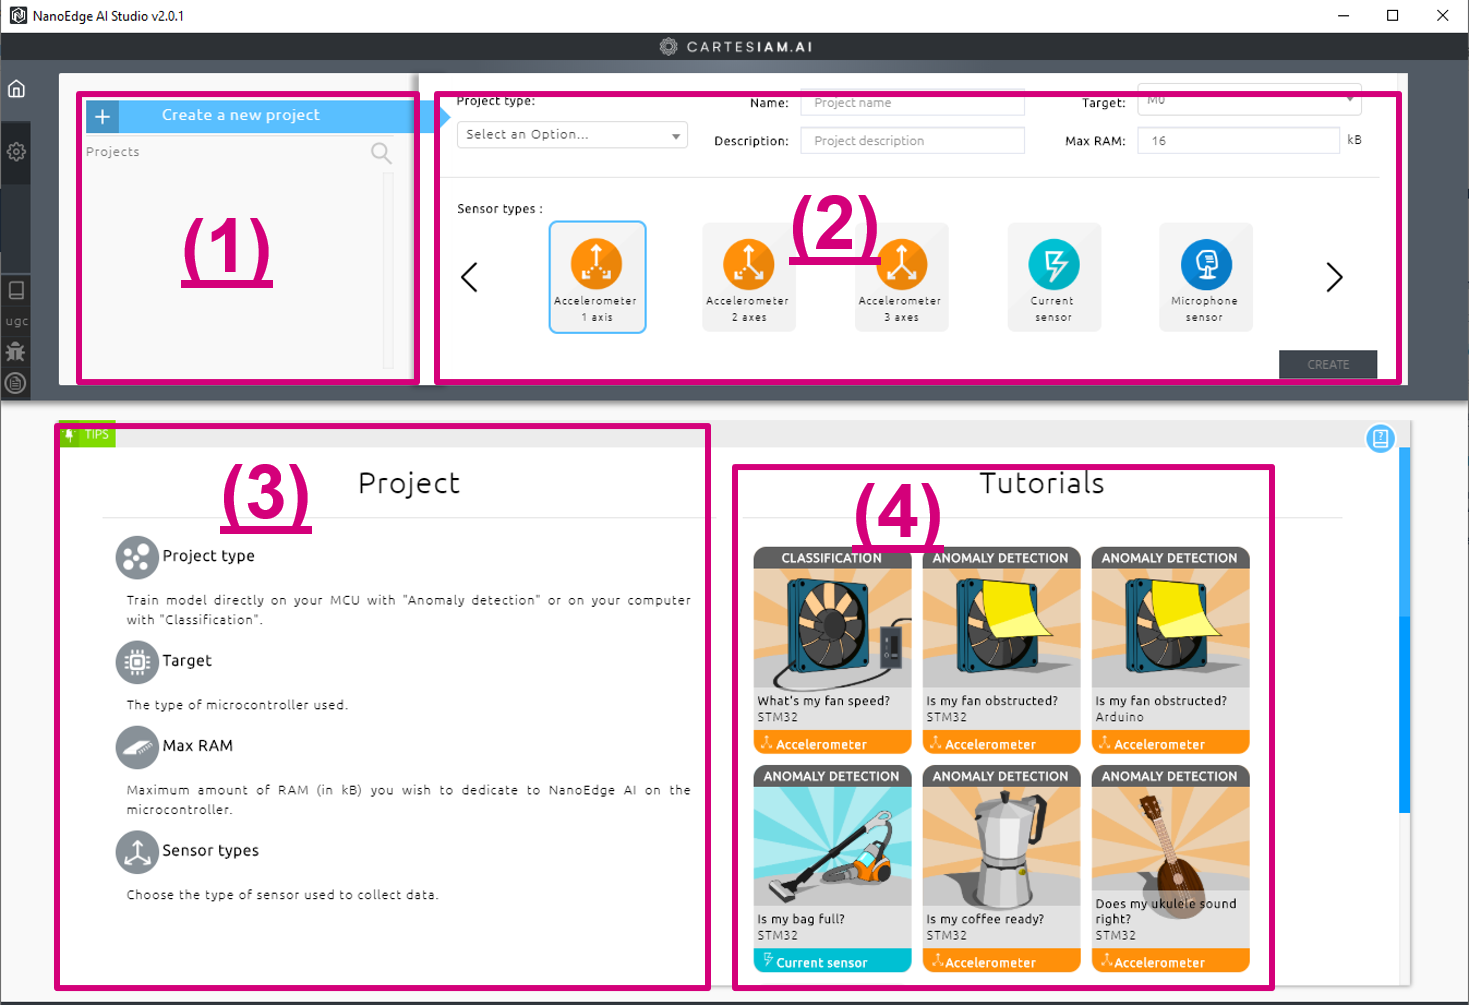
NanoEdgeTM AI Studio provides an automatic way to generate and select the best libraries for the condition monitoring of your setup based on the provided contextual data (normal and abnormal conditions). The main view of NanoEdgeTM AI Studio looks like below.
There are four panes in the main View of NanoEdgeTM AI Studio.
- 1) Existing Projects in the Workspace: A new project can be created from here or an existing project can be loaded.
- 2) Project Definition of the new project.
- 3) Tips for defining the project.
- 4) Tutorials. This section contains the links and videos of the existing tutorials.
4.1.3.1. Create a new project
For creating a new project the reader needs to provide the following information.
- Project type: Two project types are available in NanoEdgeTM AI Studio.
- Anomaly Detection: This project expects the data for normal and abnormal behavior and builds a library that lets us perform Anomaly Detection. In this wiki-article, we are using this type.
- Anomaly Classification: This project builds a library to perform the classification of the provided classes. This expects to input a file of data for every class.
- Name: Provide a name for the project to save for future references.
- Description: Describe the project to save for future references.
- Target: Selects one of the target platforms to deploy the generated library.
- Max RAM: : Define a max RAM budget in KBS for the library. The generated library fits within this RAM budget.
4.1.3.2. Import the normal data in NanoEdgeTM AI Studio
Once the project is created, it expects contextualization data for normal and abnormal conditions for generating an anomaly detection library.
This section explains the process of importing a normal data file.
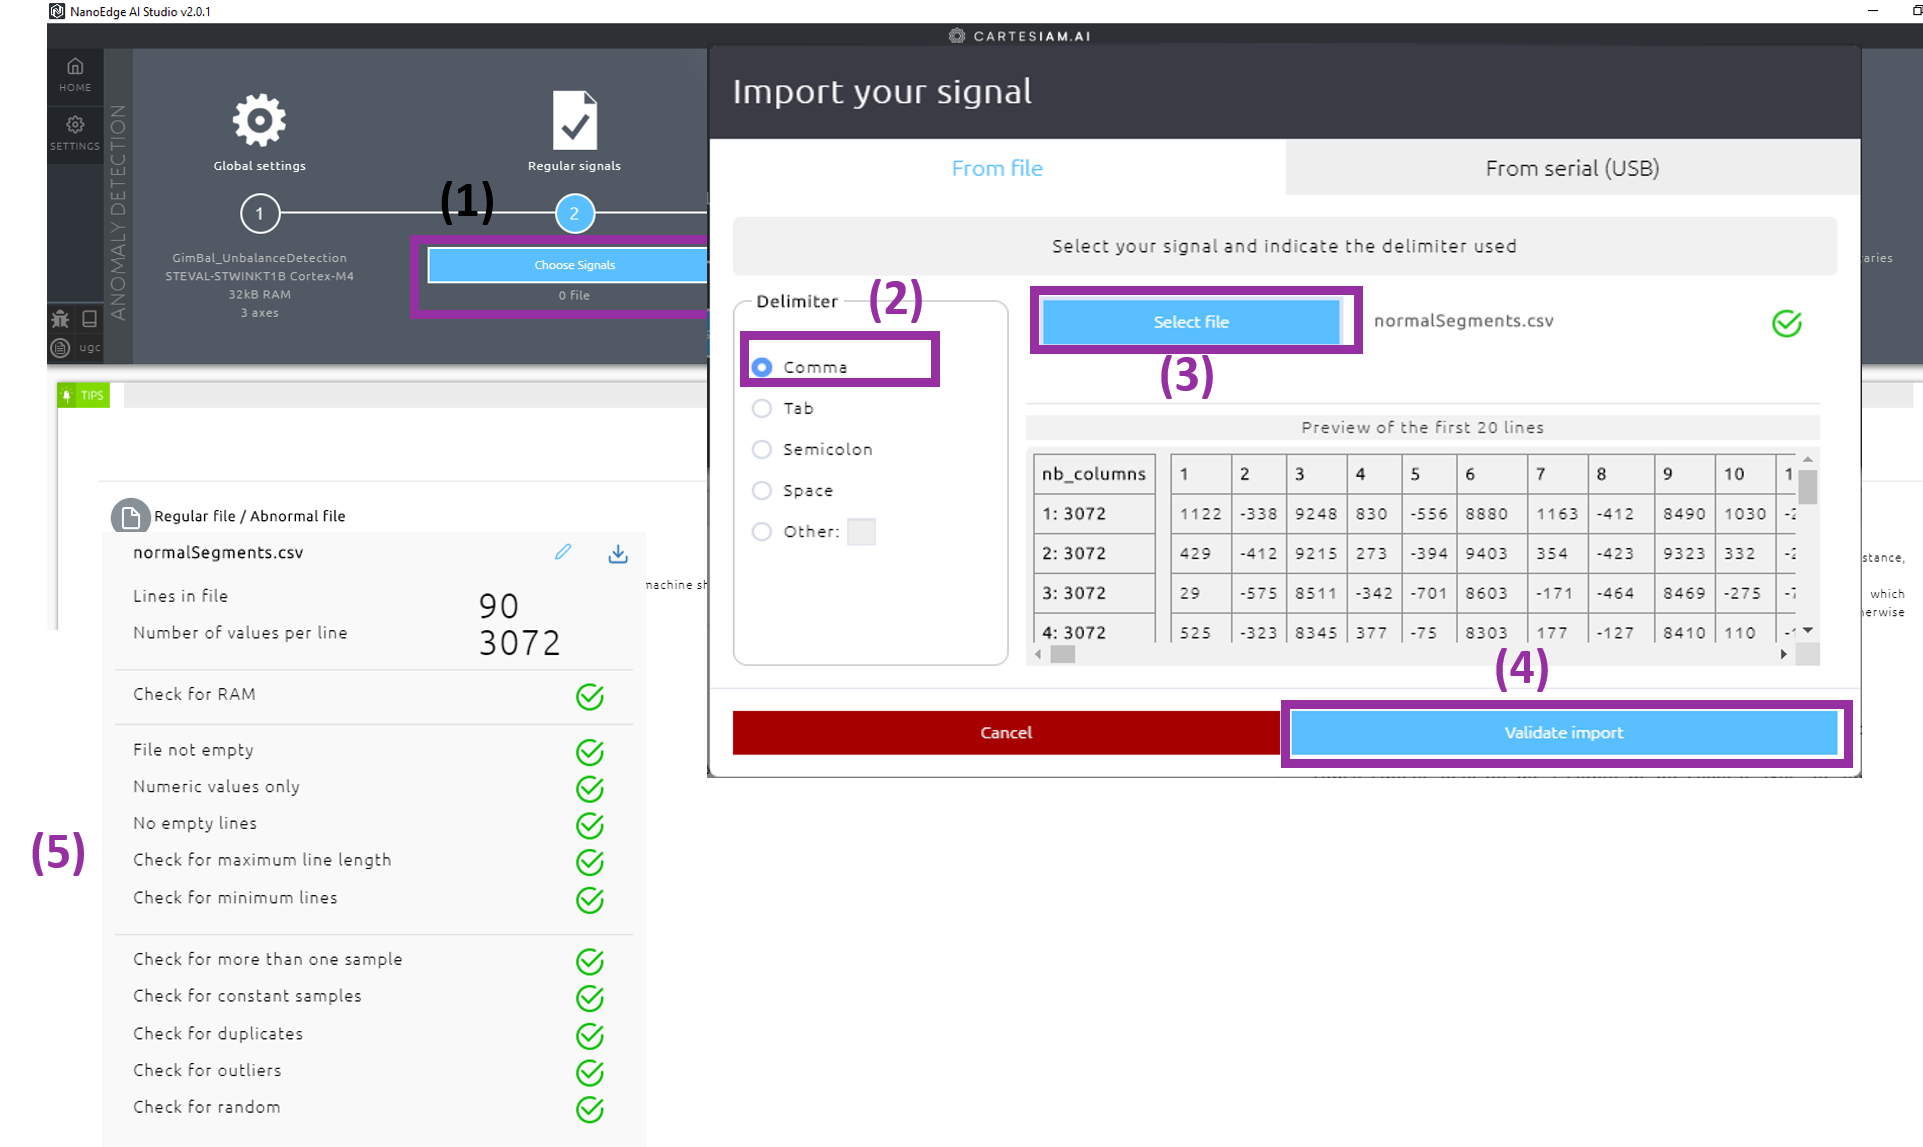
Step 1: Click on the Choose Signals button, this opens a dialog titled Import your Signal.
Step 2: Select the type of delimiter in your data file. In our case, we have a comma-separated version of the data file so we are selecting the option for Comma.
Step 3: Click on the button Select file and choose the file to be imported. This loads the first 20 lines of the data in the file in the Preview window as shown in the figure above.
Step 4: Validate the choice of the data file by click on the Validate import button.
This brings you back to the second step of the library generation process for anomaly detection and shows a preview of the data statistics for each of the three-axes, namely mean (average) and std (Standard deviation of the data segments), and showing the number of imported signals (5).
4.1.3.3. Import the abnormal data in NanoEdgeTM AI Studio
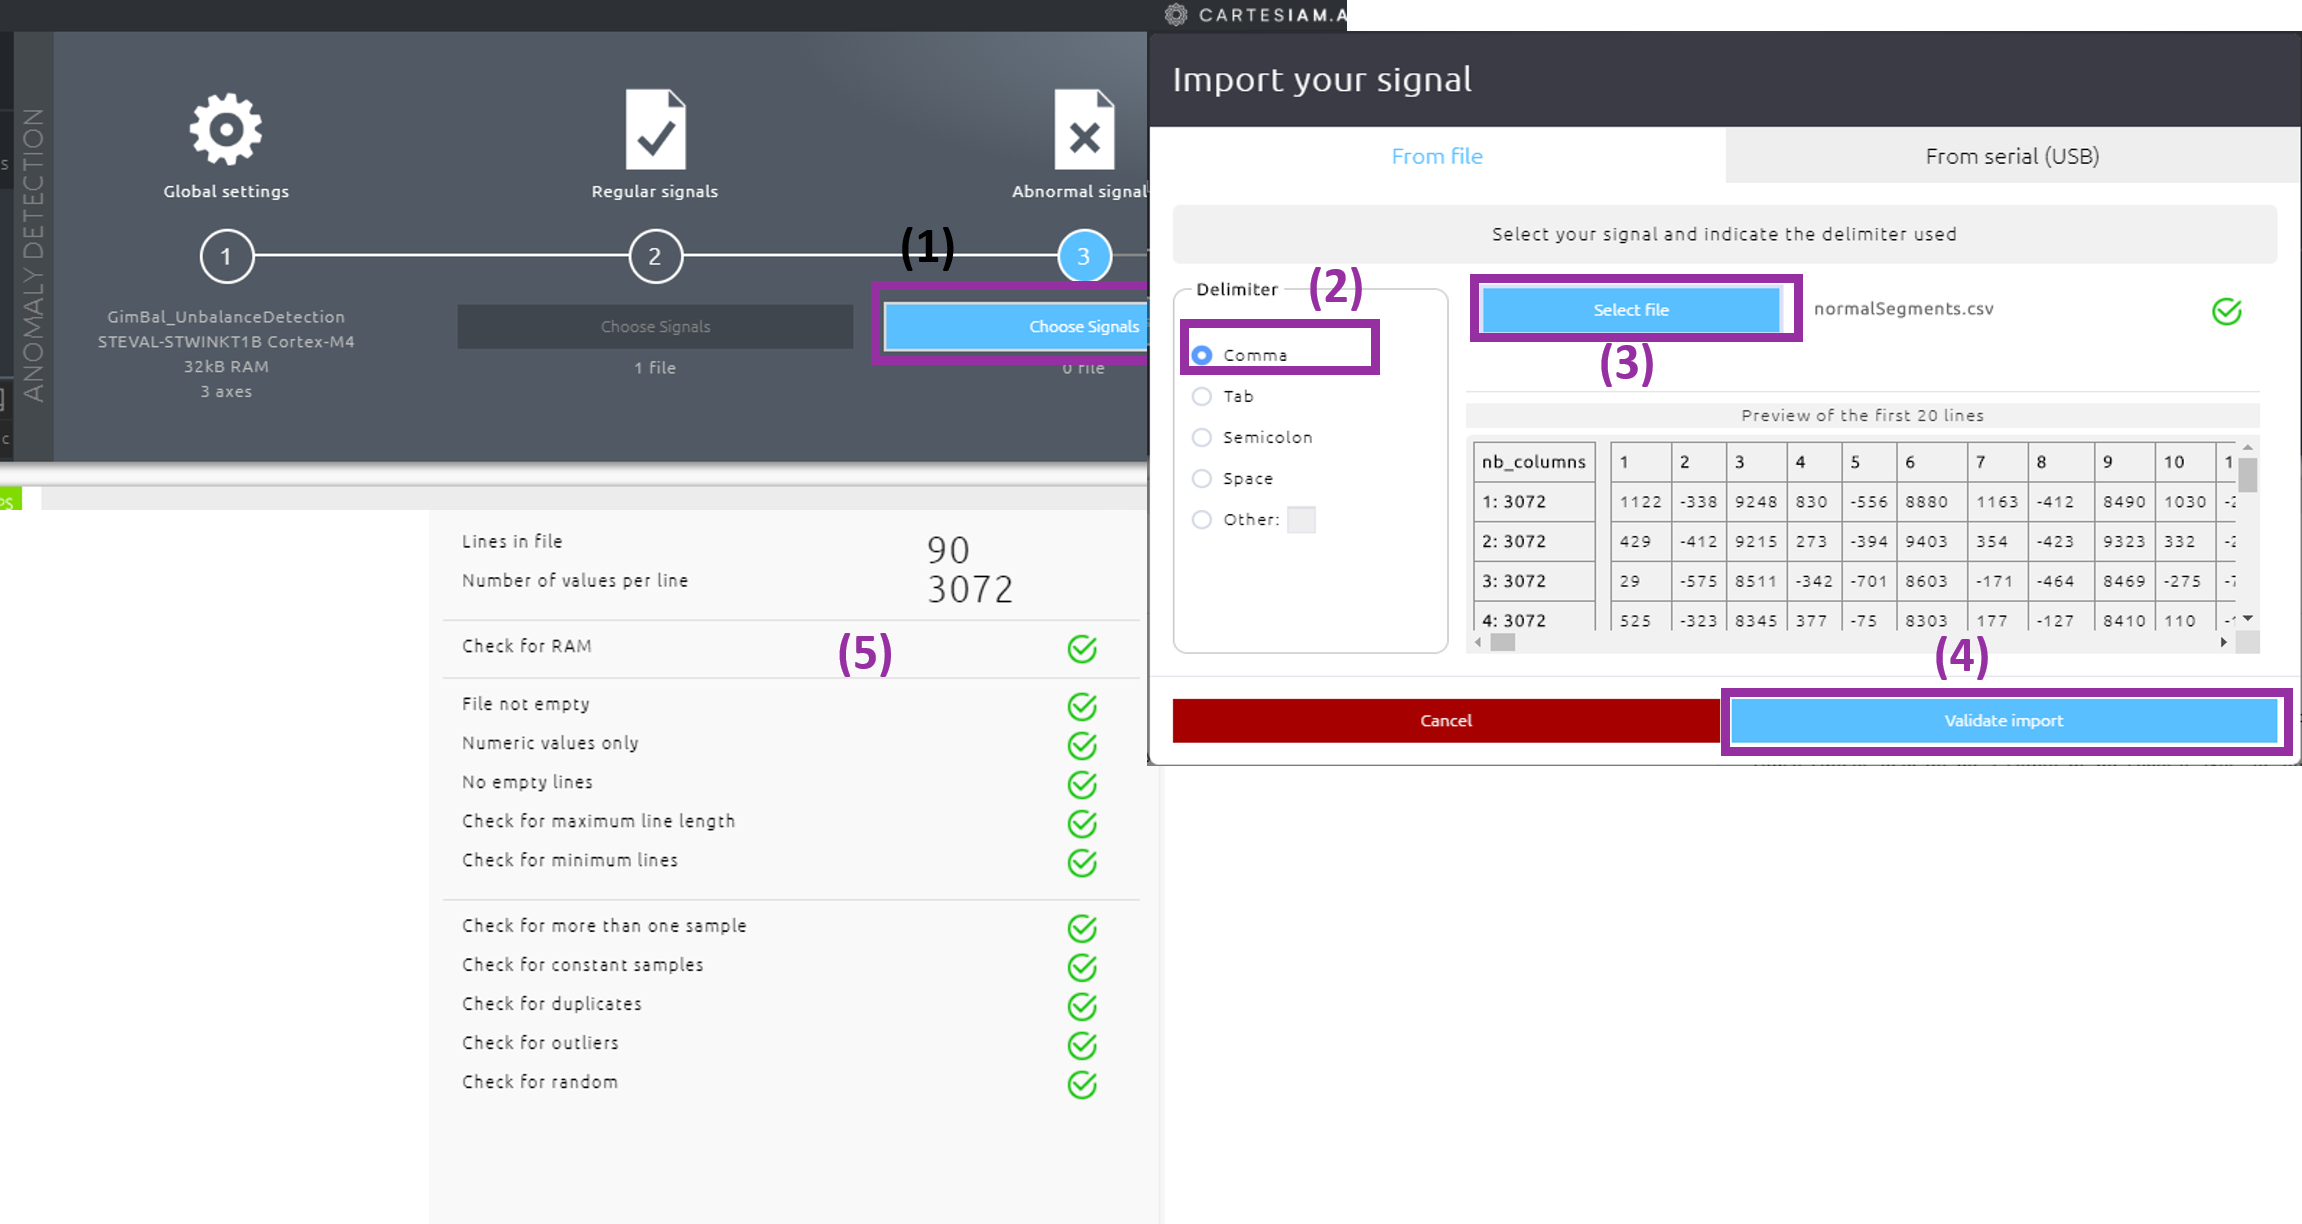
Go to step 3 in NanoEdgeTM AI Studio, and import the data for the abnormal condition following the steps used for normal data. These steps can also be seen in the figure below.
4.1.3.4. Creating the Benchmark for the AI Library
Once the data for the normal and abnormal conditions have been loaded, the process for selecting and optimizing the best library for the condition monitoring can be performed in section 4 of the NanoEdgeTM AI Studio. To start the Optimize and Benchmark process go to step 4 and press the start button. This shows a dialog by plotting the axis of the data for normal and abnormal conditions side by side. Press the Validate button and start the process of the Optimization and Benchmarking .
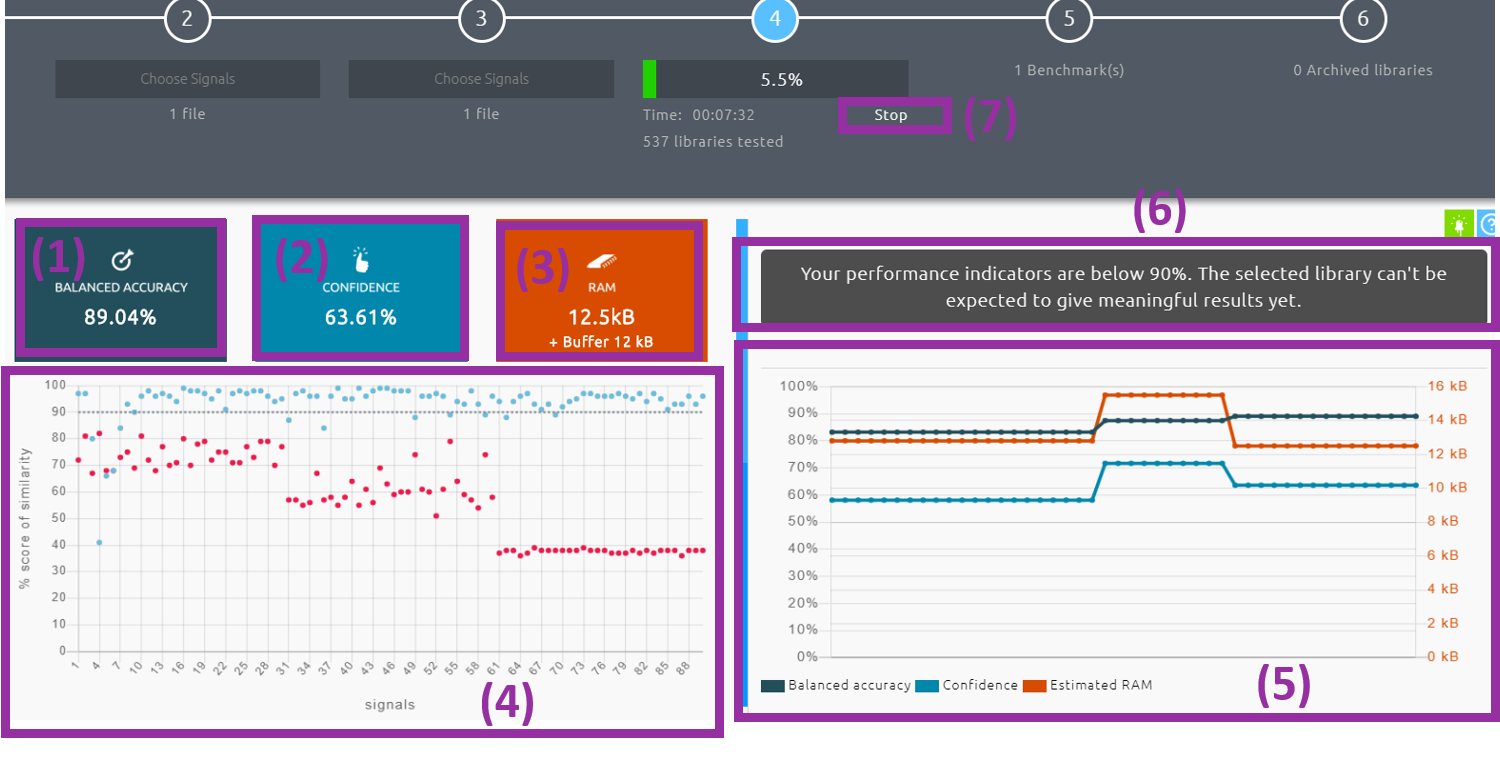
While the optimization is running the view of the NanoEdgeTM AI Studio looks like below. The optimization takes place based on three Key Performance Indicators (KPIs).
- Balanced Accuracy
- Library’s ability to correctly identify regular signals as regular, and abnormal signals as abnormal.
- 100% balanced accuracy = all signals are correctly identified.
- Confidence
- Library’s ability to mathematically separate abnormal signals from regular ones.
- 100% confidence = all regular signals are at 100% similarity, all abnormal ones at 0% (see graphs below).
- RAM
- This is the maximum amount of memory space needed by the library after your integrate it on your microcontroller.
- There is also an indication of the extra memory (“buffer”) needed for saving signal buffers.
- Balanced Accuracy
During the process of optimization, these figures are shown in real-time, as numbers in (1), (2), and (3) as well as a graph in (5). The graph in (4) provides the separation of the normal and abnormal data based on the current library under optimization, showing normal data in blue and abnormal in red. (6) shows a warning that the library results can be trusted once the metrics in (1), (2) are above 90%.
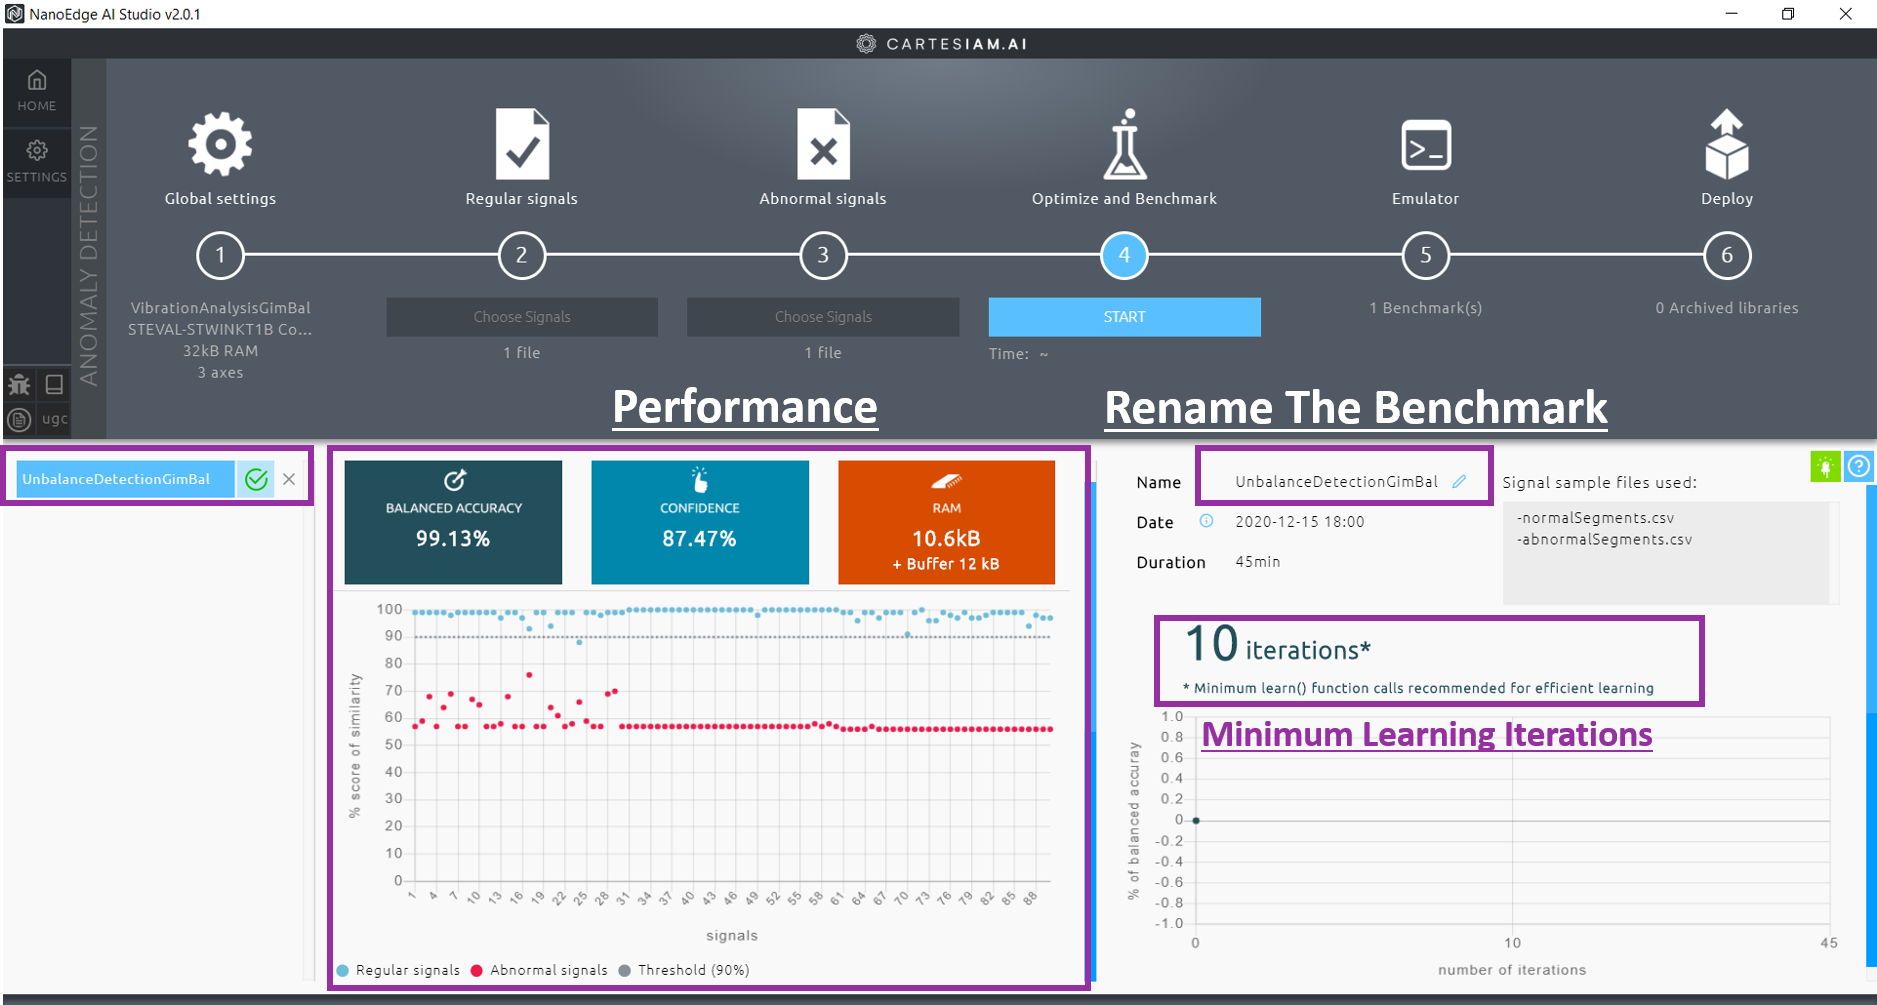
The process of benchmarking can be stopped either by clicking on the Stop button (7) next to the progress bar (if the performances have reached the required standards) or it automatically stops once the convergence is achieved by the Studio. Upon stopping, the benchmark view shows the performance of the selected library, along with an indication to tell how many minimum calls are to be made to learn a normal phenomenon.
4.1.3.5. Compiling and downloading the library
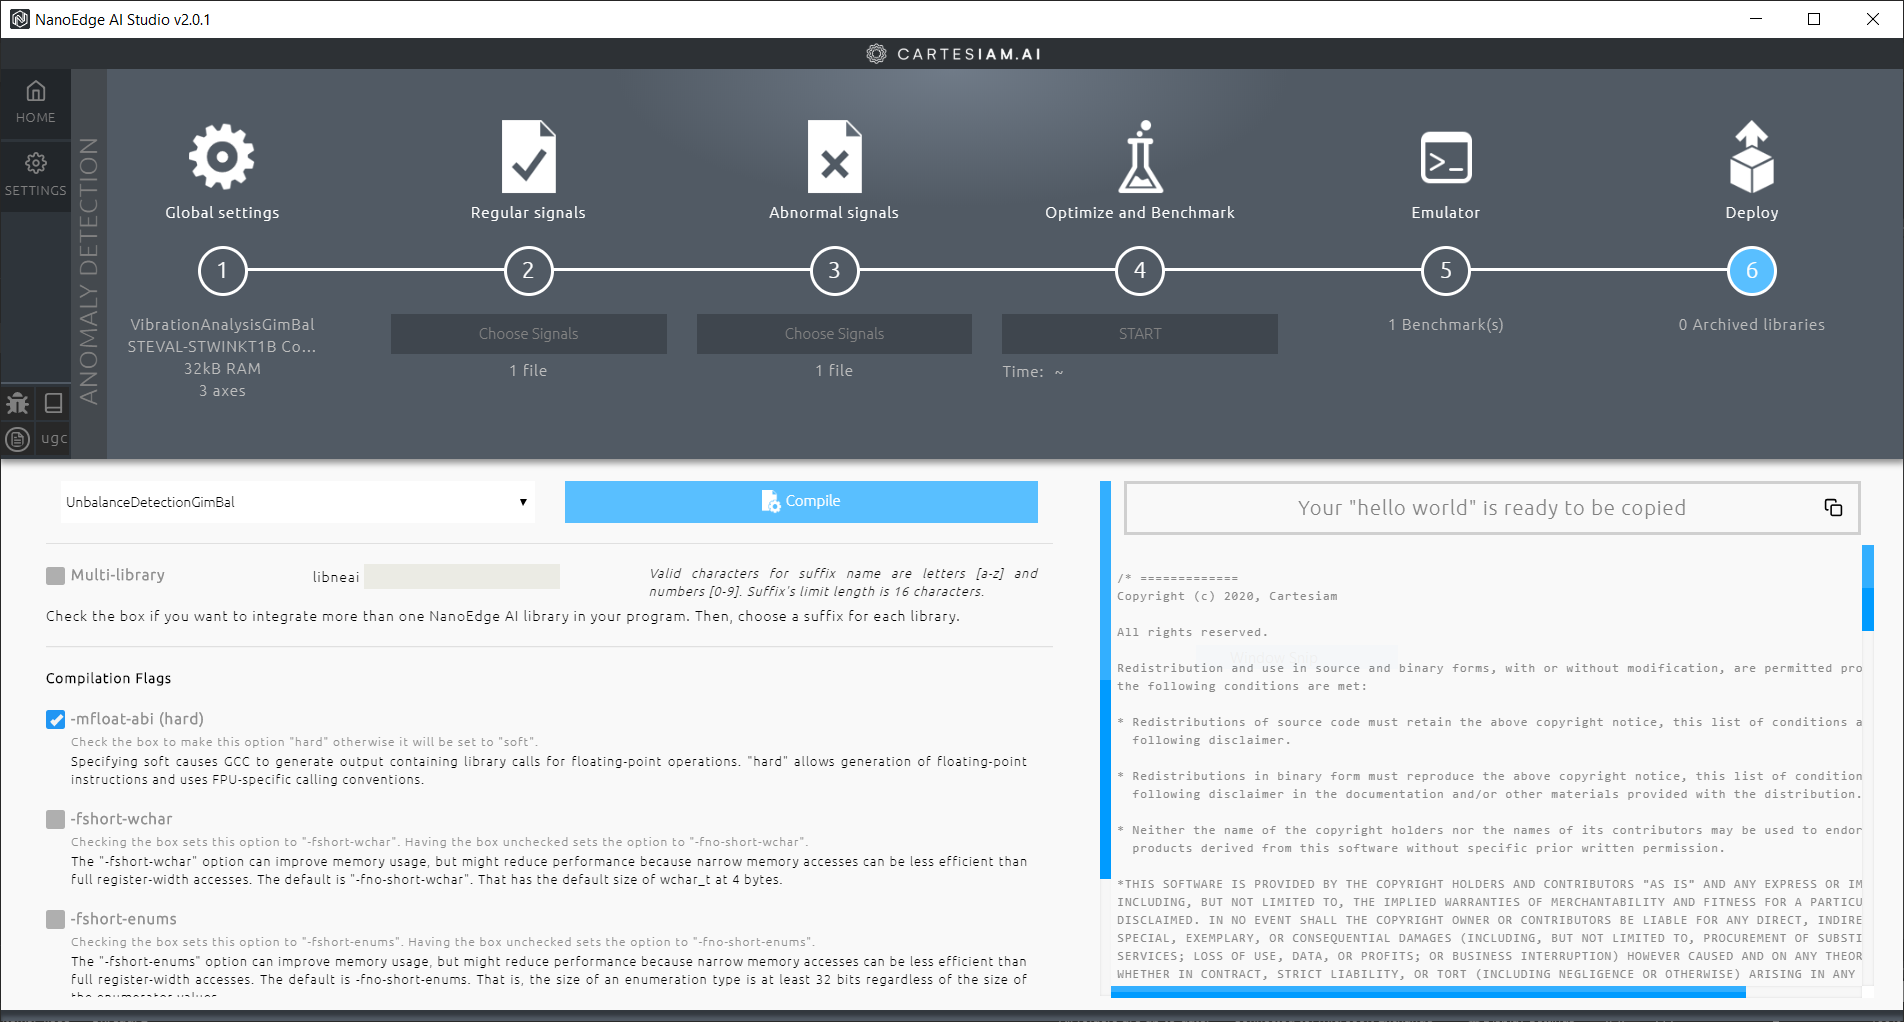
The generated libraries can then be downloaded in Step 6 by selecting the right values for the compilation as shown in the figure below.
Step 1: Choose the benchmark to be used as the library. In case there are multiple benchmarks generated, the users have a choice to choose any of the benchmarks for which they want to generate the library.
Step 2: Select if the generated library is to be used in a multi-library environment. This option lets users deploy multiple libraries on a single MCU. If the users require this function they can specify a tag for each of the libraries to have a dedicated namespace for the APIs. This is out of the scope of this article so users can leave it unchecked.
Step 3: Check the flag named as -mfloat-abi. Leaving it unchecked goes for the "soft" option and causes GCC to generate output containing library calls for floating-point operations. "hard" allows the generation of floating-point instructions and uses FPU-specific calling convention.
Leave the other flags unchecked and press the Compile button. Select, Development version or Production version based on your requirements, for example, if you want to use the library for testing/prototyping purposes or production respectively, and press download the library.
The detailed documentation on the NanoEdgeTM AI Studio can be found at https://cartesiam-neai-docs.readthedocs-hosted.com/studio/studio.html.
4.1.4. Linking the library with FP-AI-NANOEDG1
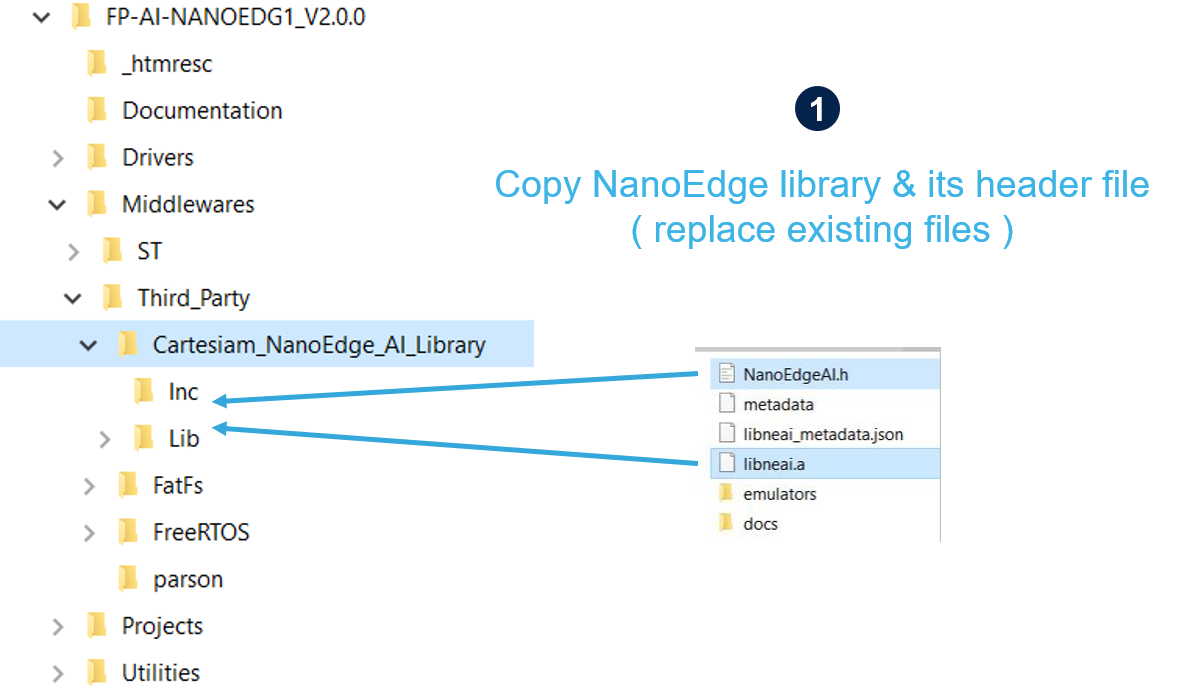
Once the libraries are generated and downloaded from Cartesiam NanoEdgeTM AI Studio, the next step is to incorporate these libraries to FP-AI-NANOEDG1. The FP-AI-NANOEDG1, comes with the library stubs in the place of the actual libraries generated by NanoEdgeTM AI Studio. This is done to make it easy for users to link the generated libraries and have a place holder for the libraries, which are generated by following the steps provided in the previous section. To link the actual libraries, the user needs to copy the generated libraries and replace the existing stub/dummy libraries and header files NanoEdgeAI.h, and libneai.a files present in the folders Inc, and lib, respectively. The relative paths of these folders are /FP_AI_NANOEDG1_V2.0.0/Middlewares/Third_Party/Cartesiam_NanoEdge_AI_Library/ as shown in the figure below.
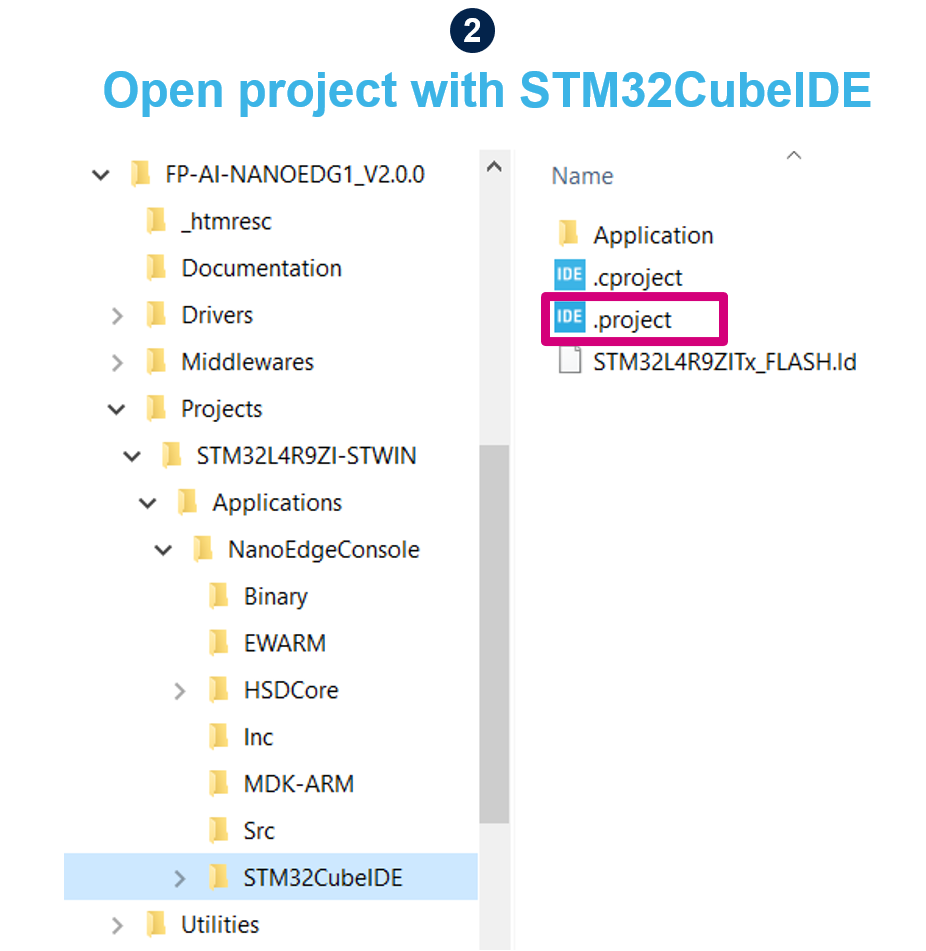
Once these files are copied, the project must be reconstructed and programmed on the sensor board to link the libraries. For this, the user needs to open the .project file from the FP-AI-NANOEDG1 folder, located at the path /FP_AI_NANOEDG1_V2.0.0/Projects/STM32L4R9ZI-STWIN/Applications/NanoEdgeConcole/STM32CubeIDE/ as shown in the step 2 in figure below.
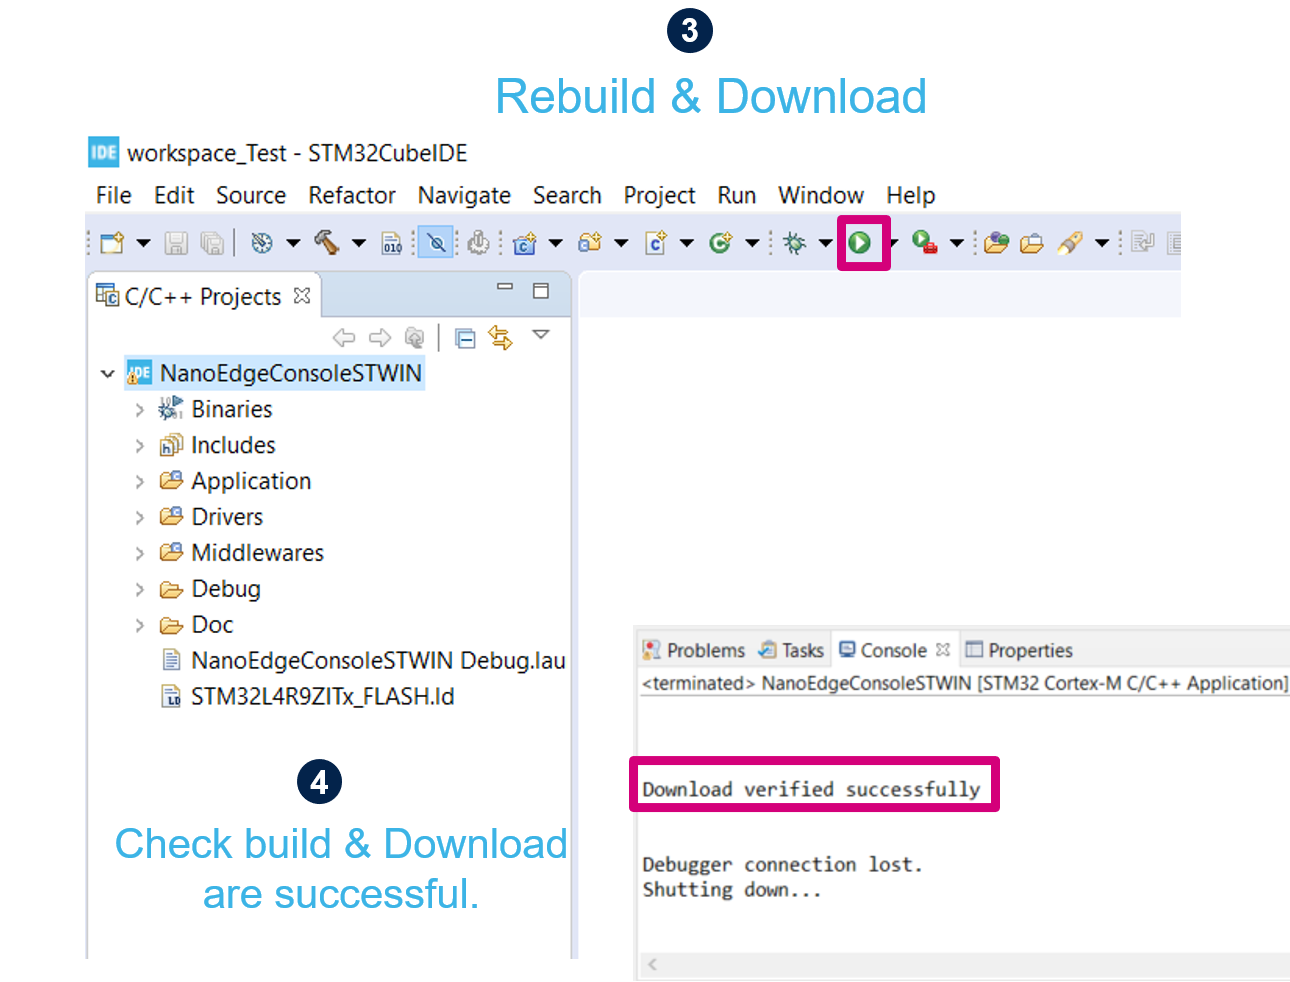
To install the new firmware after linking the library, connect the sensor board, and rebuild the project using the play button. See the console for the outputs and wait for the Build and Download success message as shown in step 4 in the figure below.
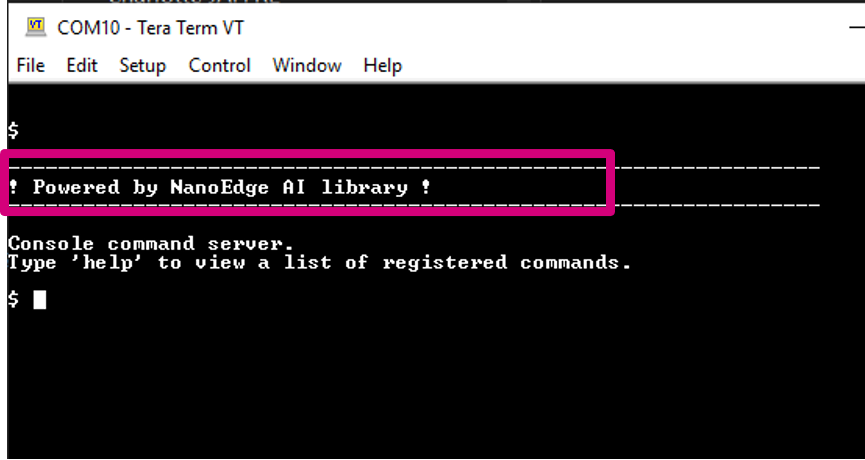
Once the sensor-board is programmed successfully, the following welcome message appears in the CLI (Tera Term terminal). If the message does not appear you can try to reset the board by pressing the RESET button.
4.2. Condition monitoring
Once the STWIN is programmed with the FW with the suitable AI library generated and downloaded from NanoEdgeTM AI Studio, the condition monitoring libraries are ready to be tested on the sensor board.
4.2.1. Learning the normal behavior
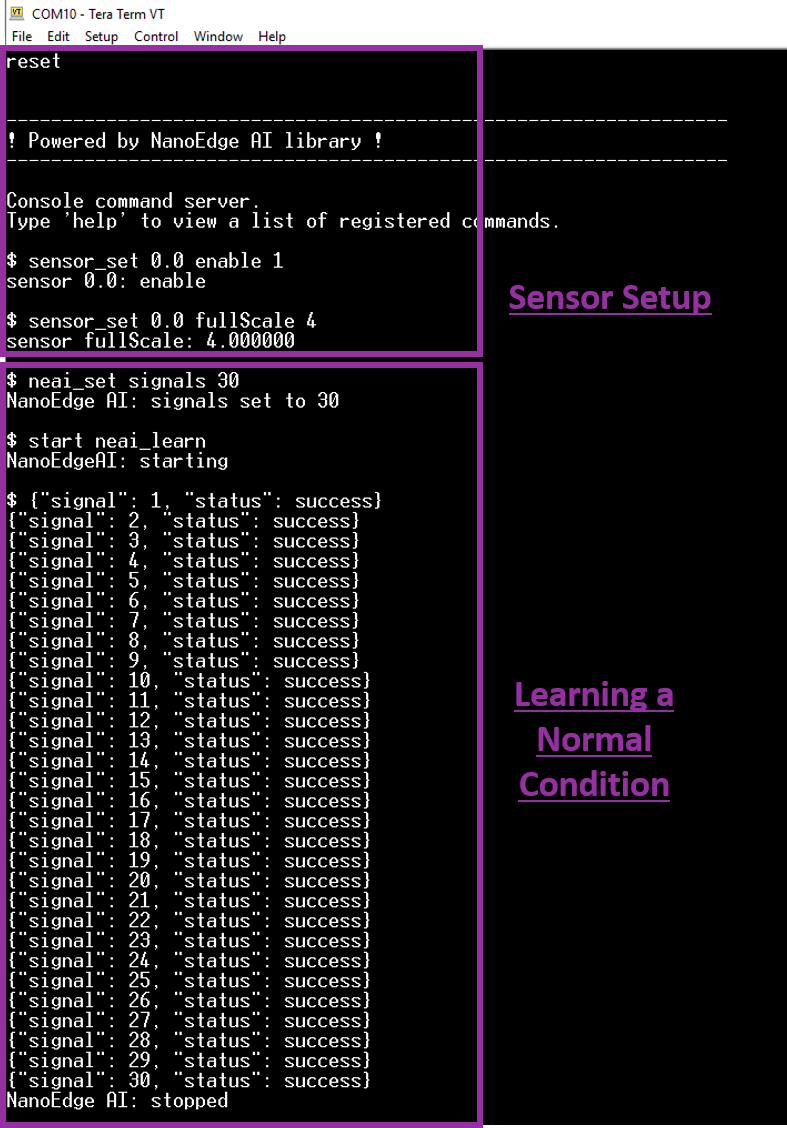
The first step is to learn the normal conditions. To do so, we have to provide the normal data for all three speeds. The first step is to set the sensor configurations. The sensor is to be configured with the same parameters as it was at the time of the data logging for contextual data.
So we need to enable the sensor 0.0 and set its fullScale value to 4, as shown in the figure below.
The learning phase can be started by simply issuing a command start neai_learn in the CLI console. However, the FP-AI-NANOEDG1 CLI also provides a capability of controlled learning. These options include specifying a period or number of signal frames for learning and detection. The process goes like described in the figure in Learning Phase. The number of signals for the NanoEdge AI context can be provided by simply issuing a command $ neai_set signals 30. This stops the learning process automatically once the learning has been performed on 30 signals as shown in the figure. The reason for choosing 40 signals is that the minimum iterations for the library were 10 and we have to perform learning on 4 or 5 times the data.
The same process has to be repeated while the motor is running at three speeds. The process goes as below:
Step 1: Run the motor at one of the three speeds.
Step 2: Start learning the behavior using $ start neai_learn command.
Step 3: Change the speed and repeat step 2 until all the speeds are learned.
4.2.2. Condition Monitoring
Once the normal conditions are learned, the user can start the condition monitoring process by starting the neai_detect mode.
This mode can be started by issuing the command
$ neai_set signals 0
NanoEdge AI: signals set to 0
$ start neai_detect
NanoEdgeAI: starting
or by short pressing the user button on the sensor board. Issuing the command $ neai_set signals 0 removes the limit on the number of signals to be used for inference and keeps the detection mode running until stopped manually.
During the process of condition monitoring whenever the similarity of the signal drops lesser than 90% there, a line is shown in the console showing the id of the signal, a condition (anomaly), and the similarity of the signal in the format {"signal": id, "similarity": XX, "status": anomaly}. Nothing is printed in the CLI console if the similarity is higher than 90% to the normal signals. Other than this the orange LED blinks fast (alternating 200 msec on-off sequence) to show the anomaly is detected.
The performance of the library can be tested by running the motor at different speeds in both balanced and unbalanced conditions (at 1000, 1250, and 1500 RPMs), as well as by turning the motor off. Ideally, there are no anomalies when the motor is in balanced mode while unbalanced and stopped conditions show abnormal behavior reporting anomalies in CLI.
NanoEdge AI libraries allow not just learning on the edge but also supports incremental learning. For example, the users can add the stopped condition of the motor as a normal condition. To do so, stop the motor and run the learning for 30 samples using the following commands
$ neai_set signals 30
NanoEdge AI: signals set to 30
$ start neai_learning
NanoEdgeAI: starting
:
:
:
Running the detection mode now indicates that the stopped condition is one of the normal conditions. This can be again done as
$ neai_set signals 0
NanoEdge AI: signals set to 0
$ start neai_detect
NanoEdgeAI: starting
Also, the condition monitoring library detects other faults such as impacts or taps on the wheel or the table/platform.
4.2.3. Fine Tuning of Library
For the convenience of the users, the CLI application also provides some handy options to fine-tune the inference and learning process of the condition monitoring easily. Users can see all the variables they can play with by issuing the following command:
$ neai_get all
NanoEdgeAI: signals = 0
NanoEdgeAI: sensitivity = 1.000000
NanoEdgeAI: threshold = 95
NanoEdgeAI: timer = 0
Each of the these parameters can be configured using neai_set <param> <val> command. The details can be found in the User manual.
The threshold parameter is used to report the anomalies. Any signal which has similarities below the threshold value is reported as an anomaly in the CLI. The default value used in the CLI application is 90. Users can change this value by using neai_set threshold <val> command.
The sensitivity parameter is used as an emphasis parameter. The default value is set to 1. Increasing this sensitivity means that the matching of the signals is to be performed more strictly, reducing it also reduces the matching calculation process, resulting in higher matching values.
For details, users are invited to read the detailed documentation of NanoEdgeTM AI Studio.
5. Resources
- FP-AI-NANOEDG1
- NanoEdgeTM AI Studio
- Getting started with FP-AI-NANOEDG1 V2.0
- Getting started with FP-AI-NANOEDG1 V1.0
- User Manual for FP-AI-NANOEDG1 V2.0
- User Manual for FP-AI-NANOEDG1 V1.0
- SensorTile Wireless Industrial Node (STWIN) Development Kit 1B
- Motor Control Nucleo Pack with NUCLEO-G431RB and X-NUCLEO-IHM16M1
- STM32 Motor Control Software Development Kit (MCSDK)
