Based on STM32 MC Motor Pilot 6.1 V1.1.3 (included in STM32 MC-SDK 6.1).
1. Overview of the STM32 MC Motor Pilot tool
The STM32 MC Motor Pilot is a monitoring tool for STM32 motor-control applications that:
- connects to MC applications built with the UI module through the serial port
- uses the snew Monitor and Control Protocol (MCPV2)
- allows for controlling, monitoring, and tuning MC applications
- replaces the monitor part of STM32 MC workbench 4.X

The added value features of the STM32 MC Motor Pilot are the following :
- Enhanced plotting feature: the user can now plot most registers.
- Real time monitoring : registers for each PWM sample can be retrieve, plot and record
- GUI customization : the user can easily customize the GUI at run time to fit specific needs or to experiment with new firmware features.
- Solid foundation to support future firmware features (ACIM, 6-Step, sensor-less zero speed, enhanced debug features).
- Runs on Windows, Mac, and Linux platforms.
2. STM32 MC Motor Pilot quick guide
2.1. Installation and run
STM32 MC Motor Pilot is now automatically installed with STM32 MC SDK.
A shortcut is created on the Windows menu to run it.
2.2. Quick start-up
When you start Motor Pilot for the first time , you can choose 3 different actions:
- Detecting the connected board.
Motor Pilot tries to communicate on all STLINK Virtual Port COM at 1843200 Mbaud to detect your board. If the detection succeeds, the Motor Pilot loads the corresponding UI.
- Loading the UI that is dedicated to the FOC SDK profiler.
- Loading the custom UI.
2.2.1. Quick step 1
If the automatic detection process failed, then press Load UI and select a qml file with the dedicated UI for your application.
At this moment, Motor Pilot is not connected:
And it lists the available serial ports:
- Connect a Motor Control board to the PC.
- Select the port and the baudrate according to your apllication.
- Click Connect.

2.2.2. Quick step 2
- Connect Motor Pilot to
- retrieve the embedded firmware features,
- retrieve important parameters of motor control from the board and adjust the GUI with such information,
- start monitoring the parameters needed by the GUI:
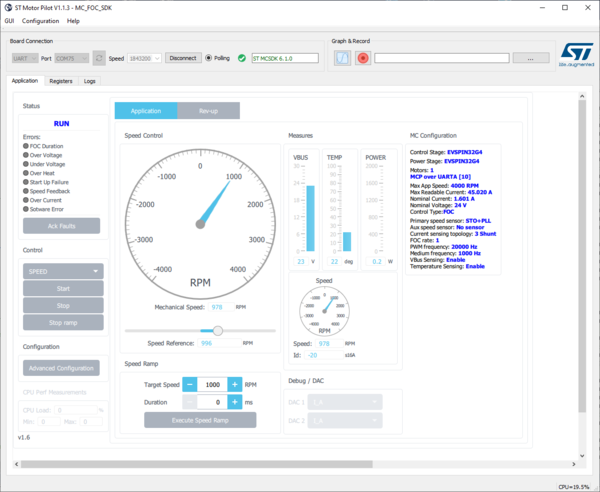
- Spin the motor by clicking on the Start button:

- Motor starts and the pilot updates the GUI:

2.2.3. Quick step 3
To control the motor, you can perform these actions:
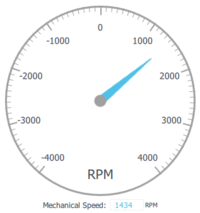
- Slide the knob to set the speed:

- Set Target Speed and Duration and click Execute Speed Ramp to apply this ramp :
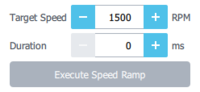
- Click Stop Ramp to immediately stop the ramp:

- Click Stop to stop spinning the motor:


3. MC application parameters
The STM32 MC Motor Pilot obtains the MC application parameters from the board and adapts widgets to them.

3.1. DAC
If the DAC feature is enabled in the firmware, the DAC widget will be enabled with its corresponding capabilties.

3.2. CPU Performance Measurement
If the MCU Load feature is enabled in the firmware, the CPU Performance Measurement widget will be enabled with its corresponding capabilties.

4. MC application advanced settings
4.1. Speed PID, Toque PID, Flux PID and Flux reference
- Click Advanced Configuration to display another panel with additional settings:
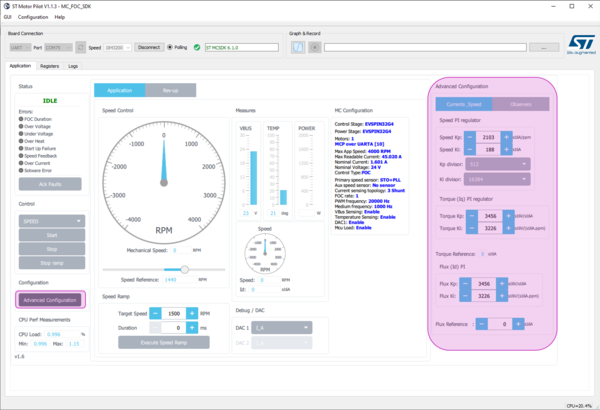
- Customize the following settings from this panel:
- Speed PID
- Toque PID
- Flux PID
- Set Flux reference

Depending of the features available on your firmware, some of the settings can be disabled.
4.2. State Observer, PLL parameters, CORDIC parameters
- Click Advanced Configuration to display another panel with additional settings.
- You can Customize the following settings from this panel:
- State Observer + PLL parameters
- State Observer + CORDIC parameters
Depending of the features available on your firmware, some of the settings can be disabled.

4.3. Rev-up configuration
Click on Rev-up tab to display rev-up parameters:

Then click on Read all to read rev-up parameters from the board.

- This panel allows to set up to 5 rev-up steps by direct edit in the corresponding table for which a step rev-up duration, a final torque value and a final speed value are defined. Use the same values to have less steps.
You can switch display from s16A to Amp but you need to fill current sensing parameters according to your board.

4.4. Handling errors
4.4.1. Control Board disconnection
Board freeze due to firmware critical error or breakpoint trigger:
- Resume execution or reset the board to resume the connection.

4.4.2. Firmware errors
Current and past errors are indicated as in the example below.
- In the FAULT_NOW state, the Ack Faults button has no effect.

- Once the fault conditions are cleared, enter the FAULT_OVER state.

- Click Ack Faults to go back to IDLE.

4.5. Viewing and plotting registers with low-speed plotting
With this method of plot, plotting any register is possible at low rate (polling every 200 ms by default).
- Click the Registers tab to display the list containing all of the registers.
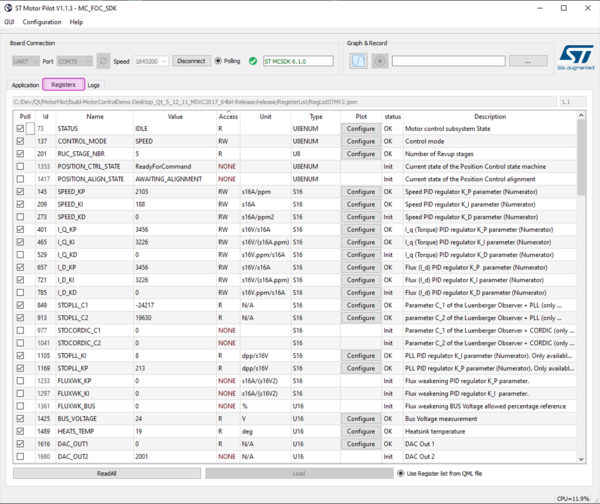
- Click the Configure button to:


- add register plot into a new plot window,

- or add it into an existing plot window.


- The user can stop plotting the register:

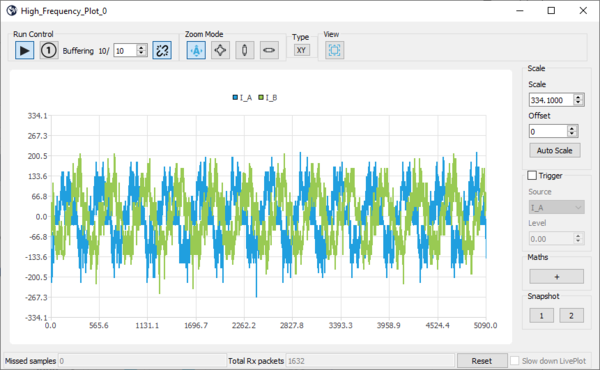
4.6. Viewing and plotting registers with high-speed plotting
Plotting at PWM frequency rate is only possible for a subset of registers with this method of plot.
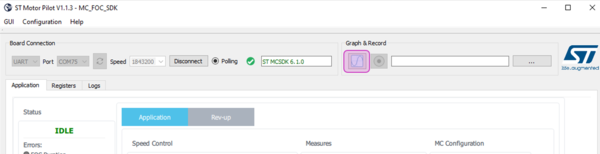
- Once the motor is connected and started, click the Plot button:
- A High Frequency Plot window opens:
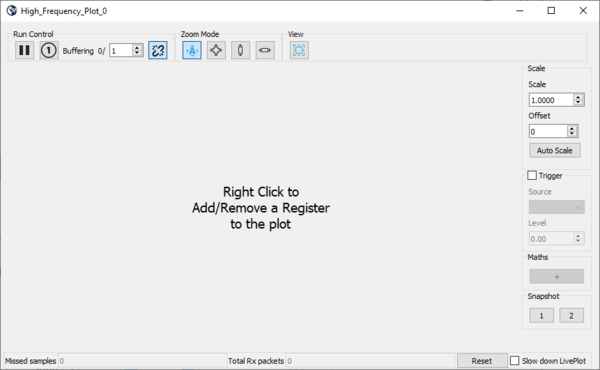
- Click again to open more plot windows.
- Resize these windows to optimize the display of plots on your desktop.
- Right-click to select the register to plot:
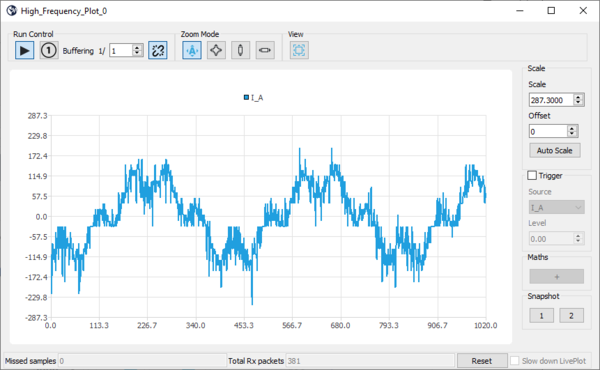
- Click again to plot more registers:
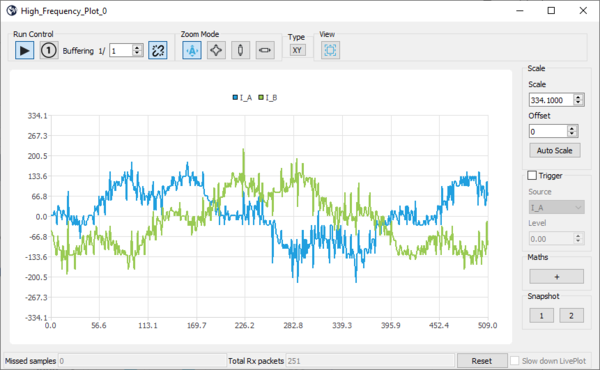
- The data display width is defined by adjusting the buffer size. Change buffering to display more data.
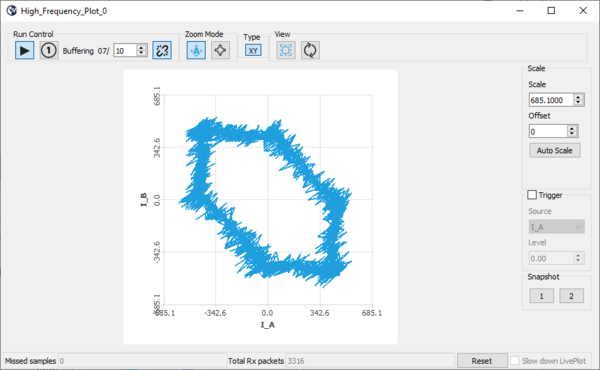
- When displaying 2 registers, you can switch to the X / Y plot:
- Dynamic plot display can be paused and resumed as desired.
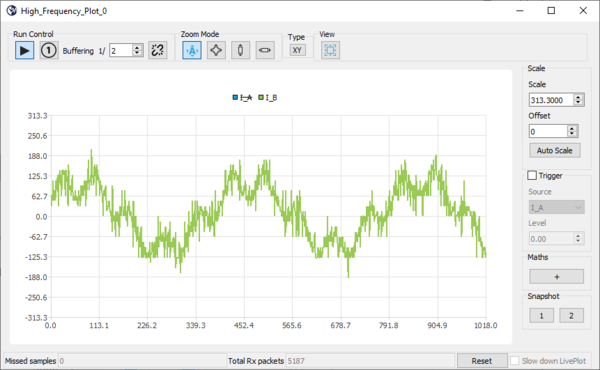
- Each register plot can be hidden or displayed by double-clicking on the register name in the plot legend. Then, when the register plot is hidden, the corresponding register name is strikethrough.


4.7. UI is changeable at run-time
- Click the File menu item, then Load.
- Search for a .qml file and open it. For instance, GUI\PositionControlApp.qml found in the release.
- This loads a new GUI with other features. In the case of PositionControlApp.qml, a position control enabled monitoring application.

- Users can change the UI by copying any existing ".qml" file and editing it.
5. Motor Profiler
The Motor Profiler software is now integrated to the Motor Pilot as a QML file. It allows the user to:
- do a basic profiling,
- do a profiling with the Hall sensors,
- do a offeset resistance detection,
- ability to see and change voltage threshold
- detect the number of Pole pairs with guided detection.
5.1. Board connection
Like for the Motor Pilot, check the Board connection part, and connect the Motor Profiler tool to the control or inverter board. A Motor Profiler GUI is now accessible for the user.
As soon as the Board is connected, all pieces of information are displayed, and the Motor Profiler tool is now able to communicate with embedded FW to profile the motor.
5.2. Profiler parameter
Please, configure the required know information of the motor: Pole pairs, max speed and max current information, and voltage thresholds. Besides, the internal permanent magnet synchronous motors (IPMSM) with its Ld/Lq ratio, or the surface permanent magnet synchronous motors (SM-PMSM) can be selected.
5.3. Start Profiling
Finally, it is time to press the "start profile" button. The motor profiling sequence starts and electrical and mechanical model parameters are successively computed during the execution of the profiling represented by the progress of the bar increment. As soon as the profiling is finished all these parameters are updated and displayed. To end, an option is proposed to save all these motor parameters into a .json file.
This error appears when the ST-Link are used by another software (CubeProgrammer, Iar). The checks made by the ST-Link can not be made. This prevents the profiler from working properly.
5.3.1. Error detected
This error appears when one of the errors present in the Firmware chapter is present. You must acknowledge the faults to start the profile.