1. Article purpose[edit source]
This article describes a trace and debug scenario for solving UART issues.
Its objective is to provide concrete use cases based on the most useful Linux® kernel trace and debug tools. It must be read in conjunction with the Trace and debug training.
2. Embedded kernel observations[edit source]
Kernel observations consist in reading information available through Linux kernel traces or kernel file system entries.
This chapter presents two sequences to check, through Linux kernel observations, that the UART driver is well probed, and configured as expected.
2.1. Prerequisites for debugging any hardware device issue[edit source]
It is recommended to download your STM32MP15 reference manual and datasheet, as well as your hardware board schematics.
These documents contain a full description and configuration information of all the related registers, as well as a board pin view to know exactly the hardware configuration that is set.
2.2. Checking the UART probe[edit source]
2.2.1. Checking the UART in the device tree[edit source]
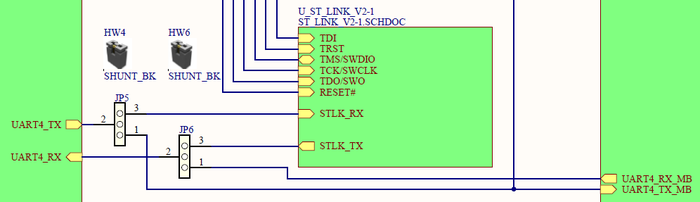
- Let us take the example of UART4 used on STM32MP15 boards to connect to a console through the ST-LINK or connector pins. Information on the hardware pin configuration can be found in the hardware board schematics. Below an example for the MB1263 daughterboard of the STM32MP157C-EV1 Evaluation board:
- In the Register boundary address table of the STM32MP15 reference manuals, you can find that UART4 registers start at address 0x40010000:

- On the embedded software side, the UART4 status at device tree level can be obtained by reading the file system entry. It illustrates how the peripheral is managed by the Linux kernel:
 cat /proc/device-tree/soc/serial\@40010000/status
okay
- Note1: the name of the device tree node uses the address given after '@', here 40010000. It corresponds to the UART peripheral register start address. Please refer to Serial TTY device tree configuration for details.
- Note2: the status is okay, meaning that the UART4 peripheral is active at Linux kernel boot. When it is off, the disabled status is returned.
2.2.2. Checking for probing messages in dmesg[edit source]
Dmesg command line utility displays on the console the content of the Linux kernel log buffer. See Dmesg and Linux kernel log for details.
You can then then search for the UART4 register start address, 0x40010000: it tells you if the corresponding driver is well probed:
 dmesg | grep 40010000
[    1.067537] 40010000.serial: ttySTM0 at MMIO 0x40010000 (irq = 26, base_baud = 4000000) is a stm32-usart
[    1.093587] stm32-usart 40010000.serial: interrupt mode used for rx (no dma)
[    1.099232] stm32-usart 40010000.serial: interrupt mode used for tx (no dma)
The above command result also shows that the corresponding ttySTM0 device is used for this driver and so assigned to UART4.
2.2.3. Checking for associated /dev[edit source]
The previous dmesg command showed that the ttySTM0 device is assigned to UART4.
It is also possible to check the associated device in the /dev/ path of the Linux kernel file system.
All serial ports in the Linux kernel are assigned to a device of ttySTMx format. This is done through definition of aliases in the Linux kernel device tree.
List of aliases can be checked on the board:
 ls -l /proc/device-tree/aliases/*
total 0
-r--r--r-- 1 root root 23 Jan  6 00:40 ethernet0
-r--r--r-- 1 root root  8 Jan  6 00:40 name
-r--r--r-- 1 root root 21 Jan  6 00:40 serial0
-r--r--r-- 1 root root 21 Jan  6 00:40 serial1
In the example below, cheking the serial0 alias and /dev/ path confirms that /dev/ttySTM0 is associated to UART4:
- Checking aliases: serial0 corresponds to ttySTM0
 cat /proc/device-tree/aliases/serial0
soc/serial@40010000 --> is UART4
- Checking tty devices:
 ls -l /dev/ttyS*
crw------- 1 root tty 246, 3 Jun 18 14:54 /dev/ttySTM0
Once the UART probe has been checked, look at its hardware configuration.
2.3. Checking the UART hardware configuration[edit source]
2.3.1. Checking the clocks[edit source]
Once the UART driver probe is done and valid, look at UART4 hardware configuration.
The corresponding kernel driver proposes sysfs entries to get the status of the STM32MP15 registers for the corresponding internal peripheral.
First check the UART clock settings. Information on the clock source is available in the device tree node:
uart4: serial@40010000 {
	compatible = "st,stm32h7-uart";
	reg = <0x40010000 0x400>;
	interrupt-names = "event", "wakeup";
	interrupts-extended = <&intc GIC_SPI 52 IRQ_TYPE_LEVEL_HIGH>,
			      <&exti 30 1>;
	clocks = <&rcc UART4_K>;
	wakeup-source;
	power-domains = <&pd_core>;
	status = "disabled";
};
In the debugfs (/sys/kernel/debug), you can find the /sys/kernel/debug/clk/clk_summary file system entry, which is a summary of the system clocks.
Below an example of command line that can be used to check the clocks associated to the UART peripheral:
 grep -E "clock|uart" /sys/kernel/debug/clk/clk_summary | sed 's,\s\+, ,g' | column -t
 Clock      enable_cnt   prepare_cnt   rate            accuracy   phase
 uart8_k   0                  0                    64000000   0               0
 uart7_k   0                  0                    64000000   0               0
 uart6_k   0                  0                    64000000   0               0
 uart5_k   0                  0                    64000000   0               0
 uart4_k   1                  1                    64000000   0               0
 uart8     0                  0                    98303955   0               0
 uart7     0                  0                    98303955   0               0
 …
- In the example above UART4 is clocked at 64M Hz.
2.3.2. Checking the pins[edit source]
To go on checking the hardware configuration, look at the pin settings.
The pin controller gives some useful information about pin settings in Debugfs entry.
Use the command line below to check which pins are set for UART4 and how they are configured:
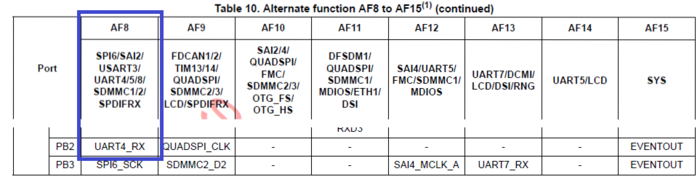
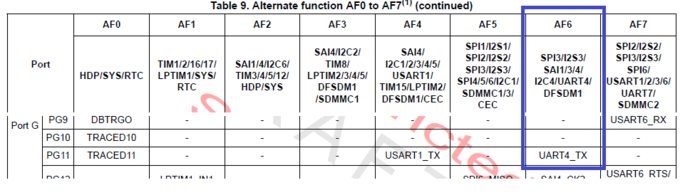
 cat /sys/kernel/debug/pinctrl/soc\:pin-controller\@50002000/pinmux-pins | grep 40010000
pin 18 (PB2): device 40010000.serial function af8 group PB2
pin 107 (PG11): device 40010000.serial function af6 group PG11

 cat /sys/kernel/debug/pinctrl/soc\:pin-controller\@50002000/pinconf-pins | grep -E "PB2|PG11"
pin 18 (PB2): alternate 8 - push pull - floating - low speed
pin 107 (PG11): alternate 6 - push pull - floating - low speed
- In the example above, PB2 pin is configured as alternate function 8, that is UART4_RX, and PG11 as alternate function 6, that is UART4_TX.
All these information can be found in the STM32MP15 datasheet:
2.3.3. Checking the interrupts[edit source]
The last hardware configuration check consists in looking at the interrupt settings.
The /proc/interrupts file system entry lists all the active interrupts.
Check that the configuration given here matches the settings available in the device-tree and listed in second insert:
- Device-tree content:
uart4: serial@40010000 {
…
	interrupt-names = "event", "wakeup";
	interrupts-extended = <&intc GIC_SPI 52 IRQ_TYPE_LEVEL_HIGH>,
	      ><&exti 30 1>;
…
};
- /proc/interrupts file system entry:
 cat /proc/interrupts | grep 40010000
           CPU0       CPU1
 26:      19907          0          GIC-0   84   Level  40010000.serial
 27:          0          0   stm32-exti-h   30   Edge   40010000.serial
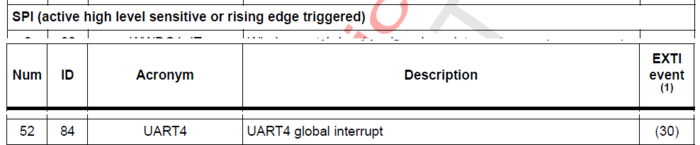
In the example above, 26 is the unique interrupt Linux id, and 84 represents the GIC hwirq (which corresponds to 52 + 32 since the interrupt Id stars at 32 for the SPI).
This value is unique for the GIC controller, so the same value can also be used by an other interrupt controller on this chip.
All UART4 interrupt settings can be found in the Interrupt list chapter of the STM32MP15 reference manual:
3. Trace and debug tools[edit source]
This chapter focuses on key Linux kernel embedded tools: dynamic debug usage and kernel Tracing framework.
3.1. Prerequisites[edit source]
- STM32MPU Embedded Software distribution available (Developer Package or Distribution Package) to be able to modify the kernel configuration options and recompile the kernel image.
- Linux kernel source code in order to be able to check the debug traces available for a given driver.
3.2. Adding dynamic printk in UART driver using dyndbg[edit source]
This example shows how to enable the dynamic trace present in the drivers/tty/serial_core.c UART core kernel driver.
Dynamic trace enabling can be done on a given line in a source file, on a whole source file, or on complete driver source files. Refer to the How to use the kernel dynamic debug wiki article for details.
Dynamic debug traces correspond to Kernel log level 7. Use the “dmesg –n 8” command to display messages of this log level 7 on the console.
dmesg –n 8
- ⇒ For additional details on the dmesg command usage, refer to the Dmesg and Linux kernel log wiki article.
As seen in the previous examples, UART4 used for the shell console is associated to the /dev/ttySTM0 device.
Writing to this device, by using an “echo” command, displays the result on the console:
echo "foo" > /dev/ttySTM0
foo
- The echo command displays the ‘foo’ string on the shell console.
First enable all the dynamic traces available in the drivers/tty/serial/serial_core.c source file:
echo "file drivers/tty/serial/serial_core.c +p" > /sys/kernel/debug/dynamic_debug/control
Then write again to the ttySTM0 device. You can observe that a new trace is displayed on the shell console, and also available on the kernel log buffer (this can be checked with dmesg command):
 echo "foo" > /dev/ttySTM0
foo
[  207.759689] uart_close(3) called
3.3. Profiling using ftrace[edit source]
As a last step, let see how to use the kernel trace feature through the ftrace tool, which is based on Kernel function tracer framework.
Refer to the Ftrace wiki article for details. This article describes the kernel configuration option to be enabled for recompiling the OpenSTLinux kernel image.
The first commands below enable the ftrace feature, according to the function_graph mode. When enabled, all function calls are listed in the trace and by CPU (0 or 1):
 mount -t tracefs nodev /sys/kernel/tracing
 echo function_graph > /sys/kernel/tracing/current_tracer
 echo 1 > /sys/kernel/tracing/tracing_on
- Note: the buffer size can be increased if it is not big enough to store the expected function calls (see Ftrace wiki page for details).
Then execute an echo command on the shell console device (on ttySTM0), and check the function stm32_start_tx call from the serial core driver. You will get the function tree, which allows to check the call stack around the function you are looking for:
 echo "foo" > /dev/ttySTM0 && grep -B1 -A6 stm32_start_tx /sys/kernel/tracing/trace
 0)               |                __uart_start() {
 0)               |                  stm32_start_tx() {
 0)               |                    stm32_transmit_chars() {
 0)               |                      stm32_transmit_chars_pio() {
 0)               |                        ktime_get() {
 0)   0.584 us    |                          arch_counter_read();
 0)   5.042 us    |                        }
 0)   9.708 us    |                      }
- The -B and –A grep command options allow to get x line before (B) and y line after (A).
Note that the function returns a execution time.
4. Controlling the code execution with gdb[edit source]
As ultimate step of the debugging scenario, you can use the GDB source code execution debugger.
It allows to add breakpoints on the kernel driver, and then observe some variables, functions and parameters to follow the driver execution and check if it is in line with the expected behavior.
All the steps required to set up this debug environment are not described here. Refer to the GDB wiki article for complete information.
An STM32MPU Developer Package must be used to get the whole environment for running OpenOCD and GDB.
GBD is a command line tool. User interactive applications can be added on top of it to act as Gdbgui (refer to the corresponding wiki article for details).
As exercise, you can try to add a breakpoint in a UART driver function (such as uart_ioctl()), and check the code execution as soon as characters are dispayed on the console.
5. References[edit source]