This message will disappear after all relevant tasks have been resolved.
Semantic MediaWiki
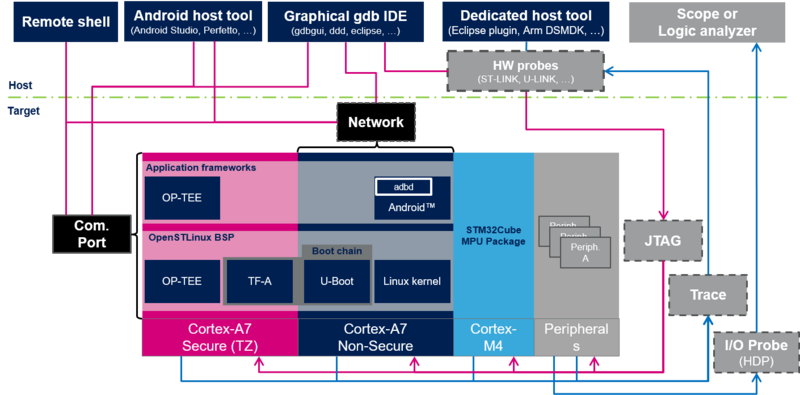
There are 1 incomplete or pending task to finish installation of Semantic MediaWiki. An administrator or user with sufficient rights can complete it. This should be done before adding new data to avoid inconsistencies.The block diagram below shows the STM32MP1 Platform trace and debug environment for Android components and their possible interfaces. Click the block diagram to directly jump to one of the sub-levels listed below:
- The STM32MPU Embedded Software package (see STM32MPU Embedded Software for Android architecture overview) that comprises:
- the STM32MPU distribution for Android™ running on the Arm® Cortex®-A and including:
- the OpenSTLinux BSP with:
- the boot chain based on TF-A and U-Boot.
- the OP-TEE secure OS running on the Arm® Cortex®-A core in Secure mode.
- the Linux® kernel running on the Arm® Cortex®-A core in Non-secure mode.
- the application frameworks composed of middleware components relying on the BSP and providing:
- OP-TEE APIs to run Trusted Applications (TA) that allow manipulating secrets (not visible from the Linux® and STM32Cube MPU Package).
- Android APIs to run applications that typically interact with the user via a display or a touchscreen.
- the OpenSTLinux BSP with:
- the STM32Cube MPU Package runs on the Arm® Cortex®-M core: like other STM32 microcontrollers, it is based on HAL drivers and middleware components. Iit is completed with the coprocessor management.
- the STM32MPU distribution for Android™ running on the Arm® Cortex®-A and including:
- The STM32MPU peripherals shared between Cortex®-A and Cortex®-M cores (such as GPIO, I2C and SPI).
- The user interfaces or tools, which allow interacting with different trace and debug Tools, such as:
- The remote shell using terminal console
- The Android host tools (such as Android Studio)
- The debugger tools (such as GDB)
- The graphical IDE (such as GDBGUI or SystemWorkbench)
- The trace and debug interfaces or hardware paths that provide access to trace and debug components through:
- the network interface (e.g. Ethernet)
- the communication port (e.g UART)
- the hardware connector interfaces:
- JTag port
- Trace port to access ETM, STM, ITM and SWD
- I/O probes to access HDP
- The hardware probes (such as ST-Link).
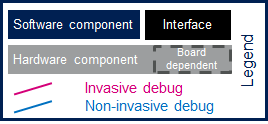
This block diagram also illustrates the Arm® debugging modes:
- Invasive debug: debug process that allows controlling and monitoring the processor. Most debug features are considered invasive because they enable you to halt the processor and modify its state.
- Non-invasive debug: debug process that allows monitoring the processor but not controlling it. The embedded trace macrocell (ETM) interface and the performance monitor registers are non-invasive debug features.
Click the figure below to directly jump to the component you want to trace, monitor or debug:
- Select a hardware component to be redirected to the corresponding hardware board article and check if the hardware connector is supported on your board.
- Select a target software component to be redirected to an article that explains in details how to trace, monitor or debug the corresponding component.
- Select a host software component to be redirected to an article that explains how to use the corresponding remote tool.
Arm® is a registered trademark of Arm Limited (or its subsidiaries) in the US and/or elsewhere. ![]()
Arm® is a registered trademark of Arm Limited (or its subsidiaries) in the US and/or elsewhere. ![]()