1. Article purpose
This article provides the basic information needed to start using the Linux kernel tool: sysprof[1].
2. Introduction
The following table provides a brief description of the tool, as well as its availability depending on the software packages:
![]() : this tool is either present (ready to use or to be activated), or can be integrated and activated on the software package.
: this tool is either present (ready to use or to be activated), or can be integrated and activated on the software package.
![]() : this tool is not present and cannot be integrated, or it is present but cannot be activated on the software package.
: this tool is not present and cannot be integrated, or it is present but cannot be activated on the software package.
| Tool | STM32MPU Embedded Software distribution | STM32MPU Embedded Software distribution for Android™ | ||||||
|---|---|---|---|---|---|---|---|---|
| Name | Category | Purpose | Starter Package | Developer Package | Distribution Package | Starter Package | Developer Package | Distribution Package |
| sysprof | Monitoring tools | sysprof[1] is a statistical, system-wide profiler for Linux. It helps in finding the functions in which a program spends most of its time. sysprof proposes a user interface available directly on the board display screen. |
||||||
3. Installing the trace and debug tool on your target board
3.1. Using STM32MPU Embedded Software distribution
sysprof is installed by default and ready to be used with all STM32MPU Embedded Software Packages.
 which sysprof
/usr/bin/sysprof
sysprof is integrated in weston image distribution through openembedded-core package: openembedded-core/meta/recipes-core/packagegroups/packagegroup-core-tools-profile.bb.
PROFILE_TOOLS_X = "${@bb.utils.contains('DISTRO_FEATURES', 'x11', 'sysprof', , d)}"
...
RRECOMMENDS_${PN} = "\
   ${PERF} \
   trace-cmd \
   blktrace \
   ${PROFILE_TOOLS_X} \
   ${PROFILE_TOOLS_SYSTEMD} \
   "
4. Getting started
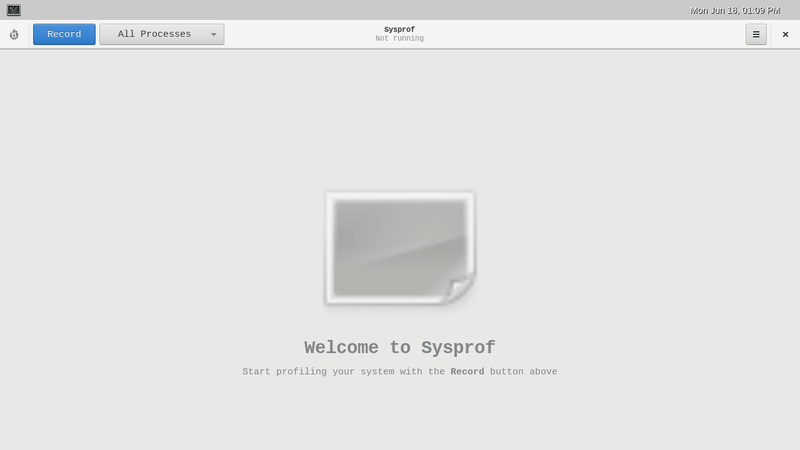
- Starting sysprof on the board:
sysprof
- Sysprof proposes a User interface through the board X interface to the display. It might be more convenient to plug a mouse (and optionally a keyboard) to use the tool interface.

- Recording
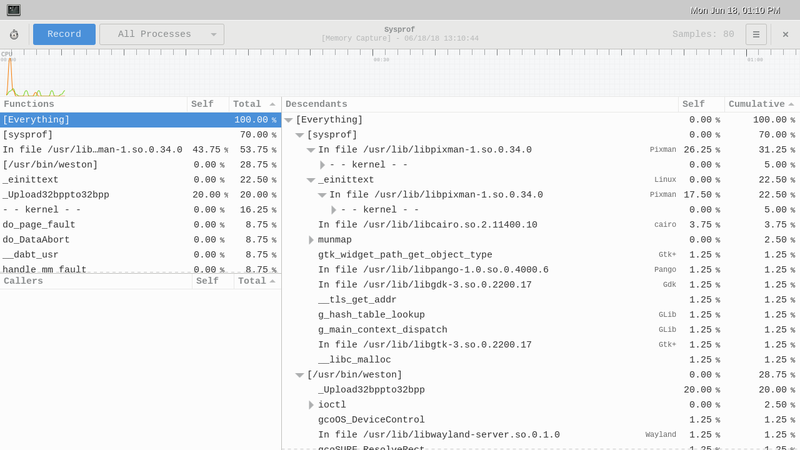
- Clicking on the top left Record button launches the recording. Recording is stopped by clicking on the top left Stop button (that replaces the record button).
- The following report is then available on the board display:

5. To go further
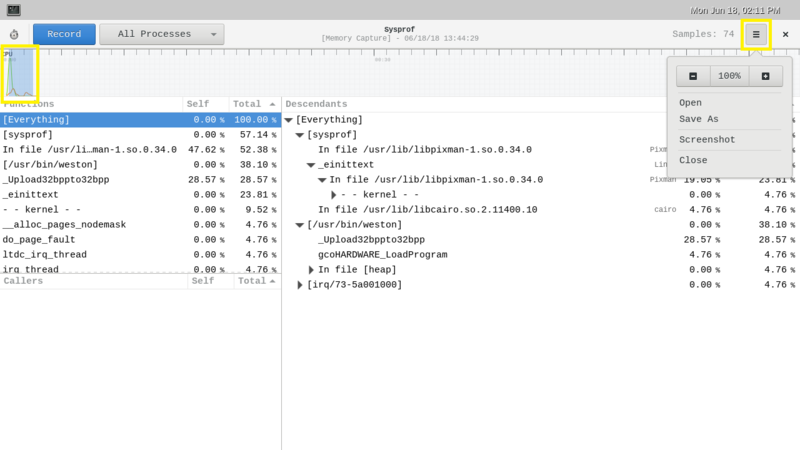
Several options are available to the user in order to filter the report, and then study the results:
- Possibility to browse on Functions list, Descendants list
- Possibility to select a certain period of the CPUs graph.
- Possibility to save traces, to make screen shots...

6. References
- Useful external links
| Document link | Document Type | Description |
|---|---|---|
| Sysprof from Gnome | Standard | Wiki page |
| Profiling using Sysprof | User manual | Linux.com |