This message will disappear after all relevant tasks have been resolved.
Semantic MediaWiki
There are 1 incomplete or pending task to finish installation of Semantic MediaWiki. An administrator or user with sufficient rights can complete it. This should be done before adding new data to avoid inconsistencies.Registered User mNo edit summary |
Registered User mNo edit summary |
||
| (18 intermediate revisions by 4 users not shown) | |||
| Line 1: | Line 1: | ||
<noinclude>{{ApplicableFor | |||
|MPUs list=STM32MP13x, STM32MP15x | |||
|MPUs checklist=STM32MP13x, STM32MP15x | |||
}}</noinclude> | |||
The block diagram below shows the {{highlight|'''STM32MP1 Platform trace and debug environment'''}} components and their possible interfaces: | The block diagram below shows the {{highlight|'''STM32MP1 Platform trace and debug environment'''}} components and their possible interfaces: | ||
* The '''STM32MPU Embedded Software''' package (see [[STM32MPU Embedded Software architecture overview]]) that includes: | * The '''STM32MPU Embedded Software''' package (see [[STM32MPU Embedded Software architecture overview]]) that includes: | ||
** The '''OpenSTLinux BSP''' and '''application frameworks''' components, running on the Arm<sup>®</sup> Cortex<sup>®</sup>-A core | ** The '''OpenSTLinux BSP''' and '''application frameworks''' components, running on the Arm<sup>®</sup> Cortex<sup>®</sup>-A core | ||
** The '''STM32Cube MPU Package''' running on the Arm<sup>®</sup> Cortex<sup>®</sup>-M core | ** The '''STM32Cube MPU Package''', on {{MicroprocessorDevice | device=15}} only, running on the Arm<sup>®</sup> Cortex<sup>®</sup>-M core | ||
* The '''STM32MPU peripherals''' shared between Cortex<sup>®</sup>-A and Cortex<sup>®</sup>-M cores (such as GPIO, I2C and SPI) | * The '''STM32MPU peripherals''' shared between Cortex<sup>®</sup>-A (on {{MicroprocessorDevice | device=1}}) and Cortex<sup>®</sup>-M (on {{MicroprocessorDevice | device=15}} only) cores (such as GPIO, I2C and SPI) | ||
* The '''user interfaces or tools''', which allow to interact with different trace and debug Tools, such as: | * The '''user interfaces or tools''', which allow to interact with different trace and debug Tools, such as: | ||
| Line 34: | Line 39: | ||
{{ImageMap|Image: STM32MP1 Platform trace and debug environment overview.png{{!}} thumb{{!}} 800px {{!}} center {{!}} STM32MP1 Platform trace and debug environment overview. | {{ImageMap|Image: STM32MP1 Platform trace and debug environment overview.png{{!}} thumb{{!}} 800px {{!}} center {{!}} STM32MP1 Platform trace and debug environment overview. | ||
rect 128 0 | rect 128 0 360 63 [[How to get Terminal | Remote shell]] | ||
rect 402 0 | rect 402 0 635 63 [[GDB]] | ||
rect 563 390 676 455 [[Linux tracing, monitoring and debugging| Linux kernel]] | rect 563 390 676 455 [[Linux tracing, monitoring and debugging | Linux kernel]] | ||
rect 563 263 676 330 [[Linux tracing, monitoring and debugging| Linux applications]] | rect 563 263 676 330 [[Linux tracing, monitoring and debugging | Linux applications]] | ||
rect 217 389 330 454 [[ | rect 217 389 330 454 [[How to debug OP-TEE | OP-TEE]] | ||
rect 341 390 439 454 [[How to debug TF-A BL2 | TF-A]] | |||
rect 341 390 439 454 [[TF-A | |||
rect 458 390 555 454 [[U-Boot - How to debug | U-Boot]] | rect 458 390 555 454 [[U-Boot - How to debug | U-Boot]] | ||
rect | rect 808 228 926 476 [[STM32CubeMP1 Package | STM32CubeMP1 Package]] | ||
rect 78 320 197 380 [[ | rect 78 320 197 380 [[:Category:STM32 MPU boards | ComPort connector]] | ||
rect 504 152 625 212 [[ | rect 504 152 625 212 [[:Category:STM32 MPU boards | Network link]] | ||
rect 936 328 | rect 936 328 1054 392 [[:Category:STM32 MPU boards | JTag connector]] | ||
rect 1005 411 | rect 1005 411 1122 472 [[:Category:STM32 MPU boards | Trace connector]] | ||
rect 1071 497 | rect 1071 497 1188 559 [[:Category:STM32 MPU boards | IOProbe connector]] | ||
rect 672 73 | rect 672 73 906 137 [[:Category:Hardware probes | HW probes]] | ||
rect 450 600 565 625 [[STM32MP13_microprocessor]] | |||
rect 515 640 625 665 [[STM32MP15_microprocessor]] | |||
<!-- | <!-- | ||
rect 217 389 330 454 [[OpteeOS]] | rect 217 389 330 454 [[OpteeOS]] | ||
Latest revision as of 13:58, 27 September 2022
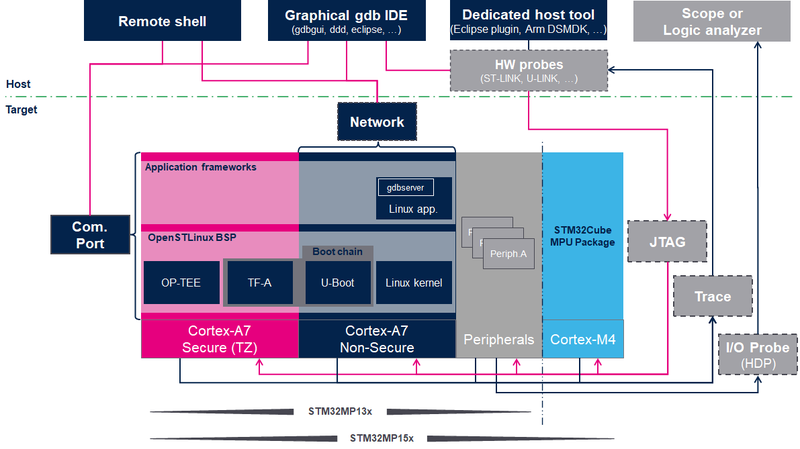
The block diagram below shows the STM32MP1 Platform trace and debug environment components and their possible interfaces:
- The STM32MPU Embedded Software package (see STM32MPU Embedded Software architecture overview) that includes:
- The OpenSTLinux BSP and application frameworks components, running on the Arm® Cortex®-A core
- The STM32Cube MPU Package, on STM32MP15x lines
 only, running on the Arm® Cortex®-M core
- The STM32MPU peripherals shared between Cortex®-A (on STM32MP1 Series) and Cortex®-M (on STM32MP15x lines only) cores (such as GPIO, I2C and SPI)
- The user interfaces or tools, which allow to interact with different trace and debug Tools, such as:
- The remote shell using terminal console
- The debugger tools (such as GDB)
- The graphical IDE (such as GDBGUI or SystemWorkbench)
- The trace and debug interfaces or hardware paths that provide access to trace and debug components through:
- The network interface (e.g. Ethernet)
- The communication port (e.g UART)
- The hardware connector interfaces:
- JTag port
- Trace port to access ETM, STM, ITM and SWD
- I/O probes to access HDP
- The hardware probes such as ST-Link.
This block diagram also illustrates the Arm® debugging modes:
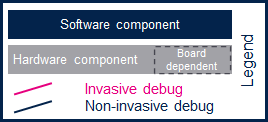
- Invasive debug: debug process that allows the control and monitoring of the processor. Most debug features are considered invasive because they enable you to halt the processor and modify its state.
- Non-invasive debug: debug process that allows the monitoring of the processor but not the control. The embedded trace macrocell (ETM) interface and the performance monitor registers are non-invasive debug features.
Click the figure below to directly jump to the component you want to trace, monitor or debug:
- By selecting a hardware component, you will be redirected to the corresponding hardware board article in order to check if the hardware connector is supported on your board.
- By selecting a target software component, you will be be redirected to an article that explains in details how to trace, monitor or debug this component.
- By selecting a host software component, you will be redirected to an article that explains how to use this remote tool.
Arm® is a registered trademark of Arm Limited (or its subsidiaries) in the US and/or elsewhere. ![]()