This article does not intend to cover all STM32CubeIDE Serial Wire Viewer (SWV) capabilities. It only provides some setup information for debugging the Cortex®-M of STM32MP15xx microprocessors in Production Mode. Complete information is available in the chapter 4 of STM32CubeIDE user guide (UM2609).
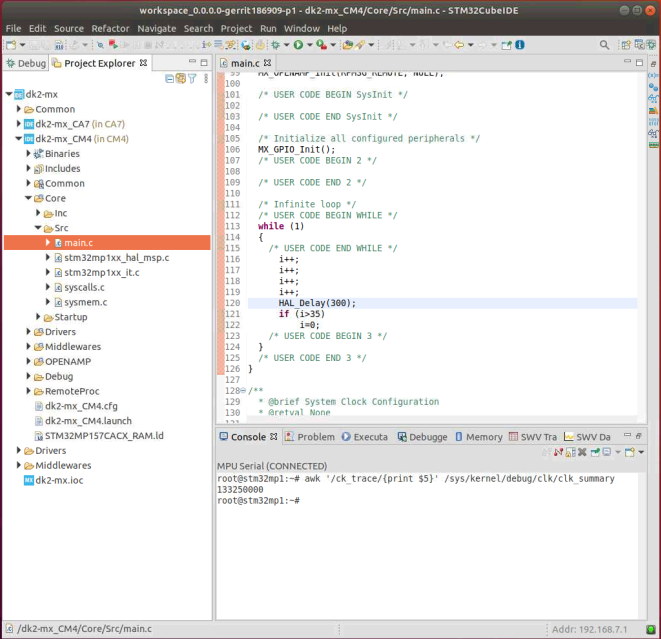
In this mode, the available console on the board (UART4) is used by the Cortex®-A Linux®. The clock tree is managed by Linux® and 'Trace clock' needed to setup SWO is available from Linux® console with command:
awk '/ck_trace/{print $5}' /sys/kernel/debug/clk/clk_summary
To make a test, modify file main.c from a generated project with a looping variable 'i', as depicted below.
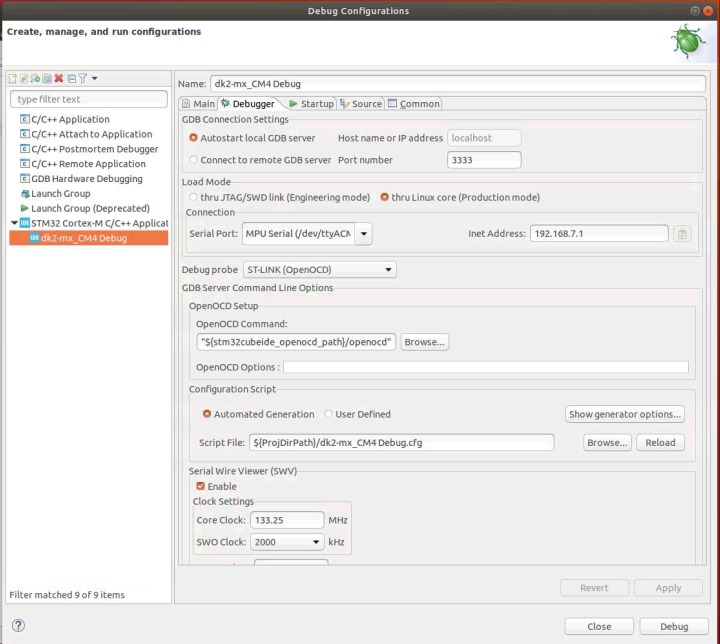
Then, setup the debug configuration, enabling SWV and setting the clock: 133.25 MHz in the example below.
Stop the debug session and open Serial Wire Views: Window > Show View > Other... > SWV > SWV Trace Log & SWV Data Trace.
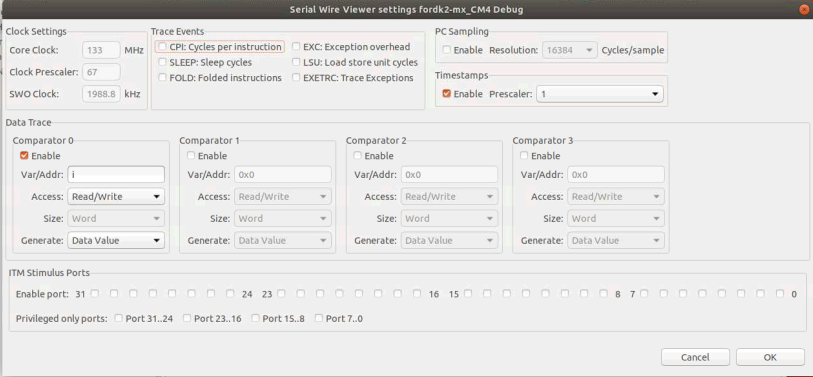
In the SWV Trace Log > Configure Trace menu, set up Comparator 0 in order to spy variable 'i'.
Then start the trace.
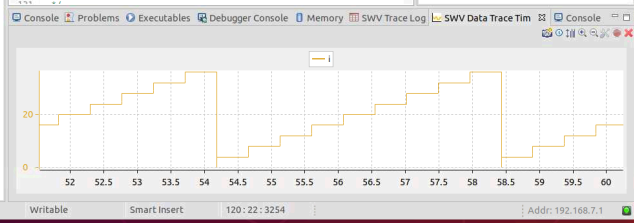
Resuming the debug session gives the corresponding graphic shown below inside the SWV Data Trace view.


