Here are the different steps explained to configure the basic flow.
1. Select the variables to monitor
This chapter introduces the easiest way to add a variable to monitor, by adding the variable to the list manually.
In the chapter STM32CubeMonitor:How to extract address from ELF files, the possibility of adding variables extracted from an executable file is presented.
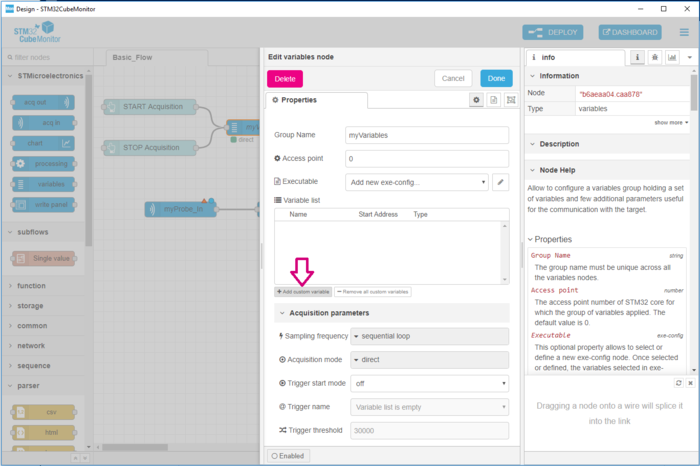
After opening the node "myVariables", variables can be added directly in the variable node by using the button Add custom variable.
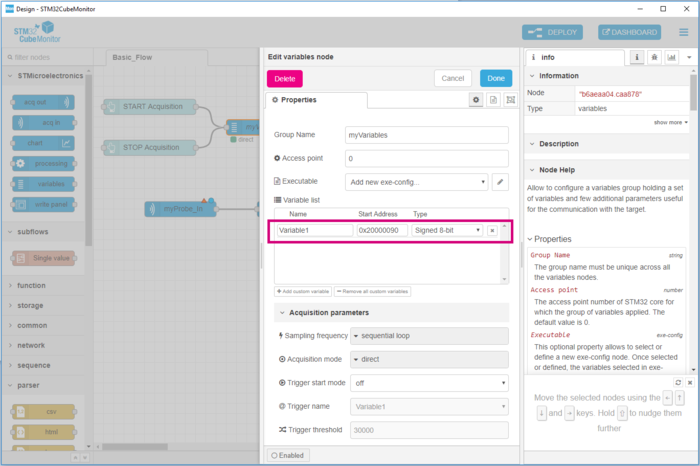
The new variable is added with default type. It is the user’s responsibility to define the name, the address and optionally the type by editing each of the table fields.
The validation of the modification in the node is done by clicking on the button "Done".
2. Select the ST-LINK used to monitor a target
Two steps are needed to select the probe which is used to perform acquisitions.
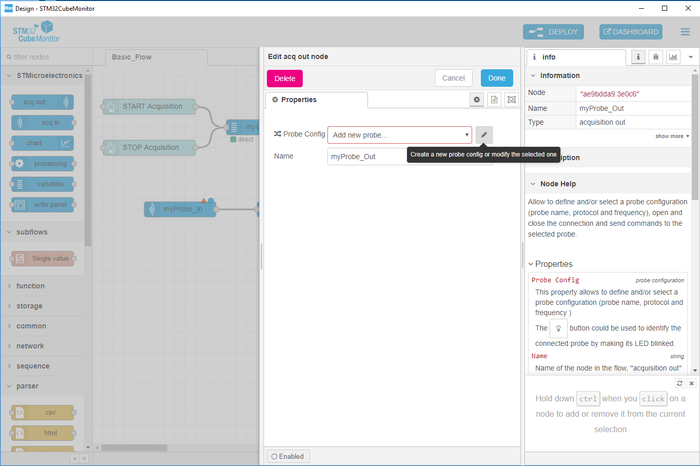
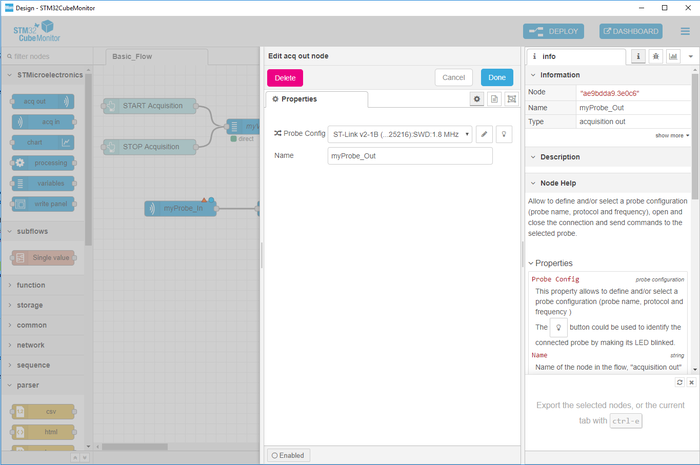
The first step is the configuration of the acquisition out node, which will be used to send commands to the probe. (out stand for "sending messages out of STM32CubeMonitor").
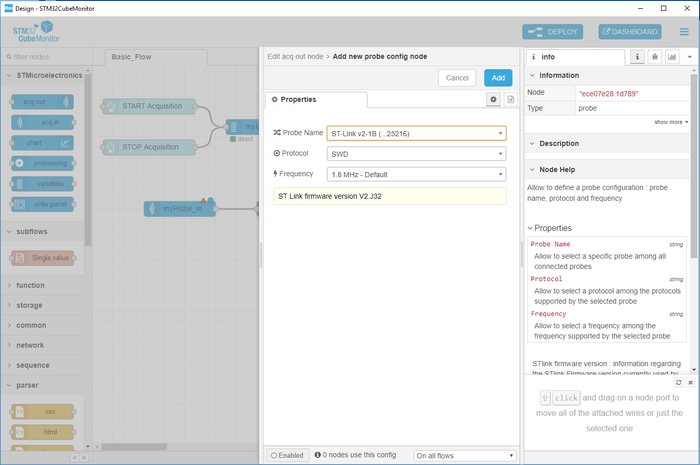
After opening the node "myProbeOut", selection of a new probe can be done by clicking on the specific button.
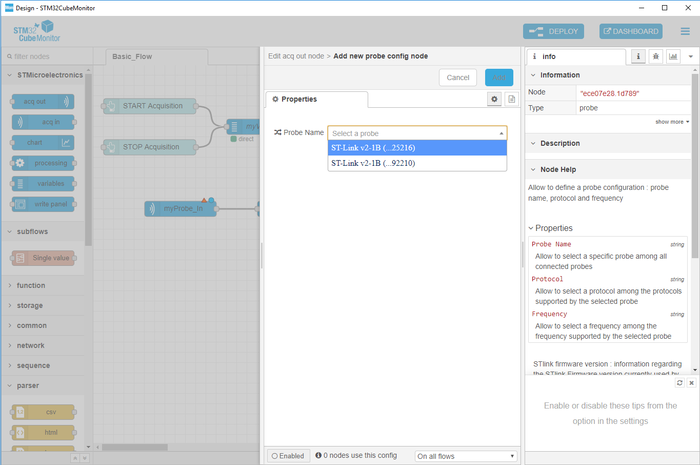
There is automatic detection of the connected probes when clicking on the picklist "Probe Name". (you need to install the driver STLINK to see the probes, see Installing STM32CubeMonitor ) .
When selecting a probe, the default protocol and frequency are selected. The firmware version is also available. (If the firmware version is not sufficient for the usage of all features of STM32CubeMonitor, there is a notification).
Clicking on the button add will add this probe configuration in the tool, making it available for all the nodes which can use it (both acquisition out and acquisition in nodes). Validation of the modification in the node is done by clicking on the button "Done".
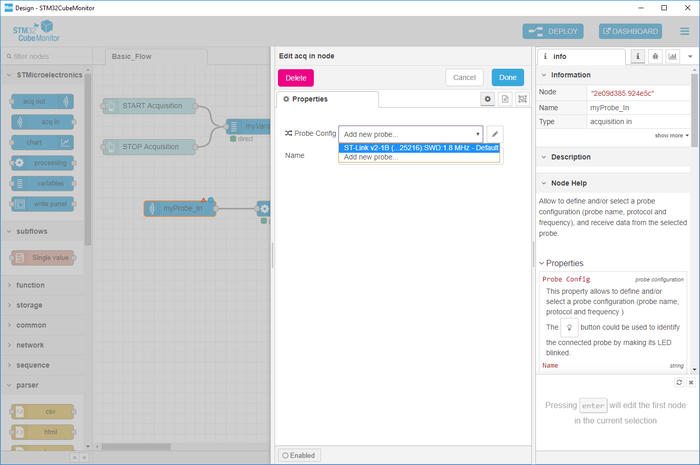
The second step is the configuration of the acquisition in node, which will receive messages sent by the probe( in standing for "receiving messages in STM32CubeMonitor"). After opening the node "myProbeIn", selection of the probe configuration is done by looking for the right probe configuration in the picklist ( probe configuration already created during the acquisition out configuration).
Validation of the modification in the node is done by clicking on the button "Done".
3. Deploy the flow to take into account the configurations done
At this point, the configuration of the nodes only exists in the editor and must be deployed to the server.
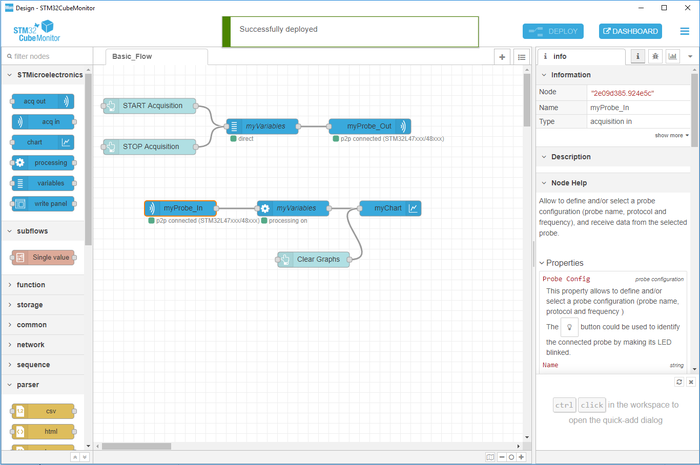
Click the Deploy button. A message should pop up at the top saying “Successfully deployed”, it means that the tool is ready to start an acquisition with the different configurations made on each node. In addition, status is available for each node.
.
For example, for the acquisition in and acquisition out node, the status of the connection and name of the target connected to the probe are displayed. The connection is checked every 15 seconds. This interval can be modified ( see STM32CubeMonitor:How to change general settings).
To start acquisition and view the dashboard, follow this link Start acquisition and view in the dashboard.
