1. Design mode
1.1. General presentation
The design mode allows users customize the monitoring of their STM32 targets according to their needs. Users can create flows with all the nodes available in the palette. Users can also import and export flows. When it is ready, a flow must be deployed to start monitoring.
The DASHBOARD button opens the dashboard mode.
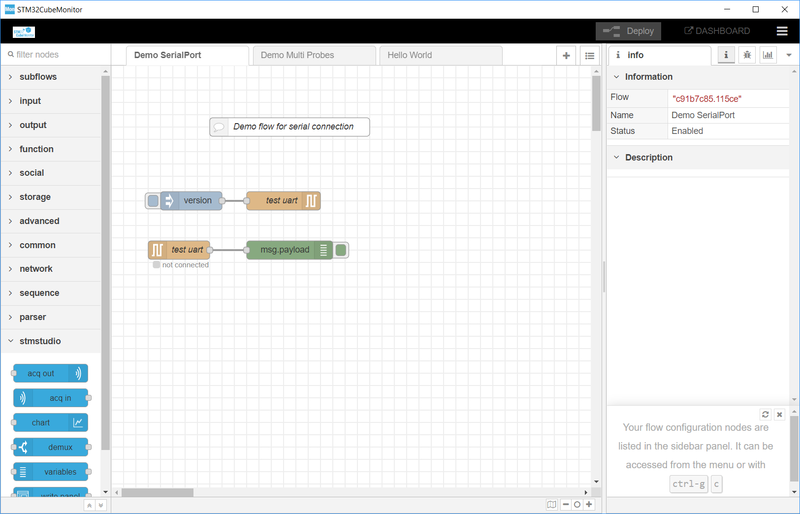
1.2. Palette
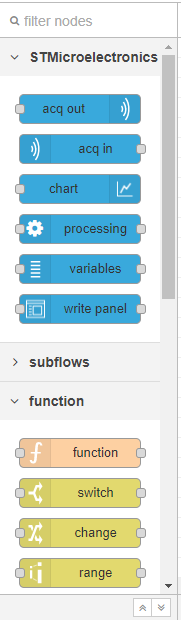
The palette is on the left of the editor window. It lists the nodes available for use in flows.
The palette contains all of the nodes that are installed and available for use.
STMicroelectronics nodes are available in the palette. They are described in the STM32CubeMonitor:List of specific ST nodes.
Extra nodes can be installed into the palette using the palette manager.
Categories can be expanded or collapsed by clicking their headers.
The ![]() and
and ![]() buttons at the bottom of the palette can be used to collapse or expand all categories.
buttons at the bottom of the palette can be used to collapse or expand all categories.
The text area above the palette can be used to filter the list of nodes.
The entire palette can be hidden by clicking the palette toggle that is shown when the mouse pointer hovers over the palette.

1.3. Help
A contextual help is available right of the editor window. It provides details about nodes.
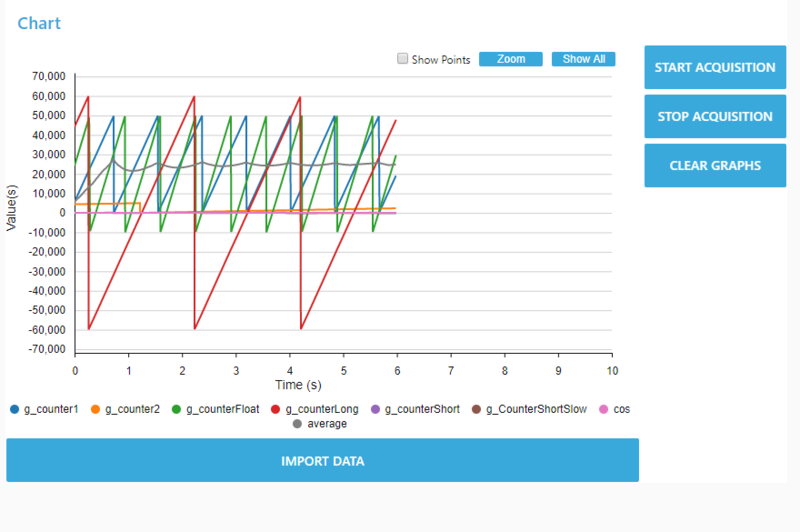
2. Dashboard mode
According to the choice and organization of dashboard nodes done in design mode, the dashboard mode allows the visualization of monitored data as charts or gauges. It also allows selecting the variables to monitor and writing them into the target.
The dashboard can be opened in a web brower (Chrome, FireFox) at http://127.0.0.1:1880/ui
---> List of specific ST nodes