This article describes how to use the acquisition mode called “Snapshot”.
Compared to the direct mode, the snapshot mode gives an accurate view of the embedded application state, but it is an intrusive mode and can disturb the behavior of the target. The snapshot mode is an alternative to the direct mode which does not give an instantaneous view of the application state.
As prerequisite for using the snapshot mode, the embedded software must be instrumented. The source code to do this is located in the installer file and named snapshot_embedded_SW.zip.
This feature is only available with STlink probe
Snapshot acquisition mode principle:
The embedded application reserves memory space for the trace buffer (containing traced data) and the trace header (containing data description and a segment for synchronization with the host PC). The STM32CubeMonitor tool fills in the data description (number of variables to trace, address and type of each variable) and the embedded application fills in the trace buffer. The embedded application must be instrumented so that variables are sampled on particular application events (user-defined).
In the embedded application:
C source code is provided in the “snapshot_embedded_SW.zip” located in the installer file. Simply add DataAcq.h and DataAcq.c files into your project and call the DumpTrace function where it is needed to sample your application state.
It is then possible to customize as needed:
- The maximum number of variables (SNP_TRC_NB_MAX_WORD_ VAR in dataAcq.h): includes a safety margin to avoid having to rebuild your application each time you want to trace one more variable. STM32CubeMonitor computes the actual record size when the acquisition session starts. This number only affects the size of the trace header. STM32CubeMonitor generates an error message if the number of variables to trace is higher than allowed by the application.
- The size of the trace buffer (SNP_TRC_BUFFER_SIZE): this size must not be a multiple of SNP_TRC_NB_MAX_WORD_VAR, but it must be able to contain at least two records. A wide buffer is preferred in order to avoid the buffer overflow, this is all the more true if your application calls “DumpTrace” frequently.
- For correct synchronization with records acquired in direct mode, a timebase must be defined, reflecting the exact time period between 2 consecutive calls to DumpTrace: this is the aim of SNP_TRC_TIMESTAMP_BASE_UNIT and SNP_TRC_TIMESTAMP_VALUE definition in dataAcq.c. In case the dumpTrace is trigged with random events, consider the time axis as event axis without time consistence.
Once the modification made in the embedded and compilation done, the STM32CubeMonitor needs to know the address of “g_traceHeader.startMark[0]”, this address is available in the map file.
In the STM32CubeMonitor tool:
The snapshot acquisition mode is configured in variables node. In “Acquisition parameters” part, the “Acquisition mode” field allows to switch to the snapshot mode.

This field is completed with the Header address which is filled automatically with the address value of g_traceHeader.startMark[0] variable from the variable list.

This address is mandatory, the variable g_traceHeader.startMark[0] must be present in your executable file. In case there is no executable file, the address header field can be filled by the user.
Do not forget that this header address is from the compilation of embedded software, from the moment you have modified the embedded software, the update of this value is needed.
The setting of the "sampling frequency" parameter must not be too low, this parameter sets the frequency at which the buffer will be emptied. If the frequency is too low, the buffer may overflow, the data will be lost.
Save the modification of variables node with pressing “Done” button and deploy the flow.
When the acquisition is launched the STM32CubeMonitor initializes the target through "acq out" probe (pass the variables to be traced, calculate the buffer size and the read pointer...). The status of this initialization is returned through “acq in” probe. In case an issue occurs, the status appears in design mode below “acq in” and “acq out” node. Be careful this status is temporary displayed, until the probe connection is established again.
During this stage some controls are done:
- Version not supported:
STM32CubeMonitor supports snapshot_embedded_SW version 8. STM32CubeMonitor makes sure that the embedded version is supported, please, in embedded side do not modify the part where the version is declared.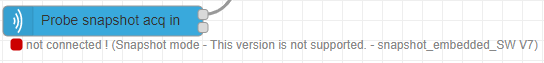
- Wrong Header address:
The traceHeader signature is not detected at the configured header address. The address provided may be different of target g_traceHeader.startMark[0] address. Update the header address according to the embedded file.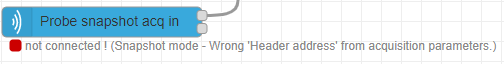


- The trigger mode is not supported:
This means that the trigger function is not supported by the embedded application. Refer to trigger article.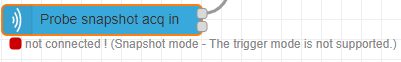

- The maximum number of variables is exceeded:
Be careful the number of variables is limited by the configuration of embedded software, see previous chapter. An error message as below appears when the number of variables is higher than allowed by the embedded software.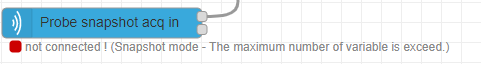

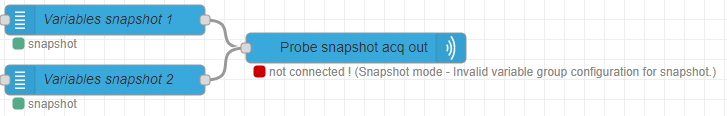
- Invalid variable group configuration for snapshot:
In case there are several snapshot variable groups connected to the same probe, the acquisition is interrupted, and the error message as below appears. In snapshot mode only, it is not possible to have several variable groups on the same probe.