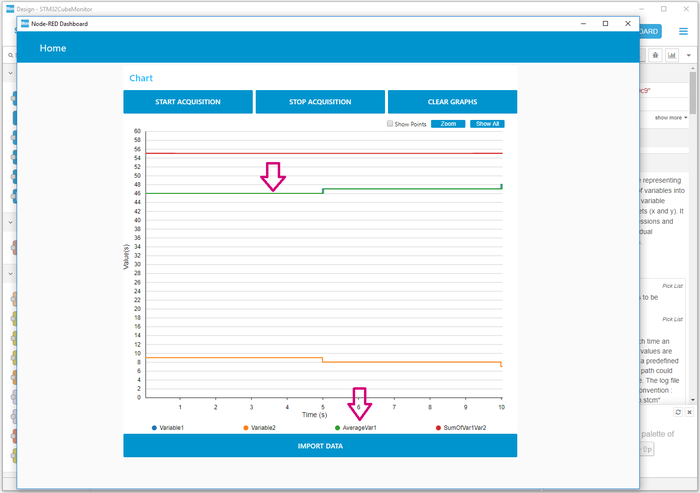
A secondary feature of the processing node is the ability to perform calculations and statistics on the monitored variables.
These additional calculations and statistics are logged as variables (see article STM32CubeMonitor:How to record and replay data) and are added as outputs of the processing node to be rendered graphically, as for the other variables.
- Operations on variables can be mathematical ( +, -, /, %, mod,...), bit-wise (& | ~), trigonometry (sin(), cos(), tan()...) or logical (and, or , not ...)
- Statistics on variables are minimum, maximum, average and standard deviation. The scope of these statistics can be the entire acquisition, or the last N points of the acquisition (N defined by the user).
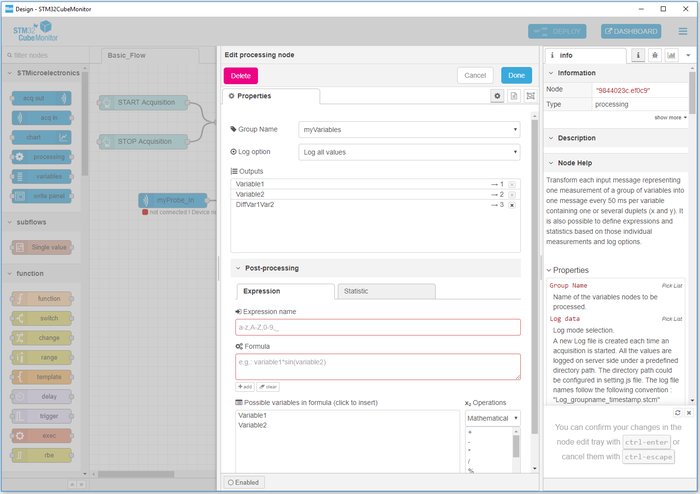
After opening the processing node, post-processing functions can be accessed by opening the "Post-processing" section. Two sheets are available:
- The Expression sheet allows expressions to be built, mixing the available variables, operations and statistics.
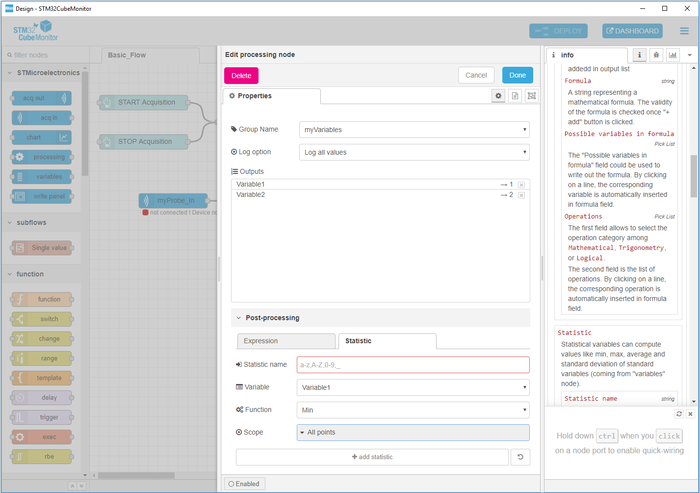
- The Statistic sheet allows statistics to be built upon the available variables, for the entire acquisition or last N points.
1. Example expression
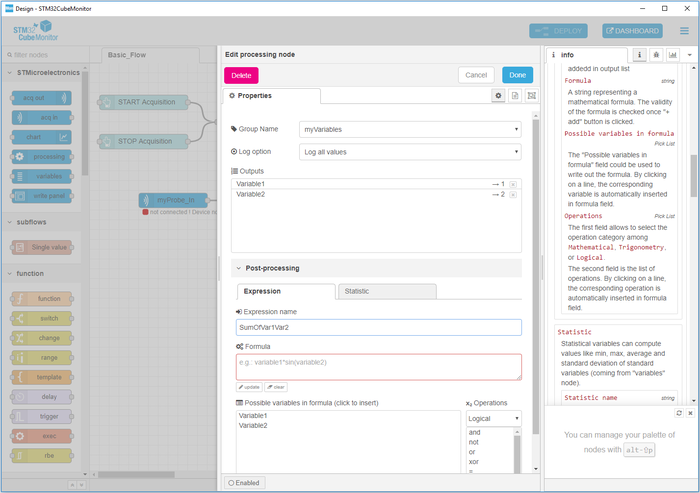
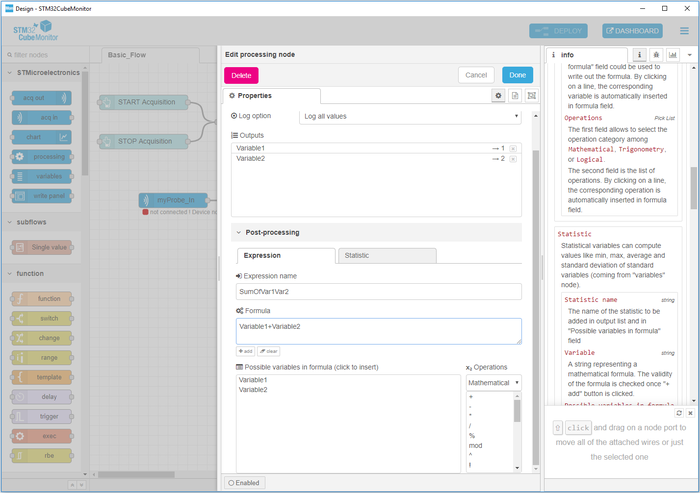
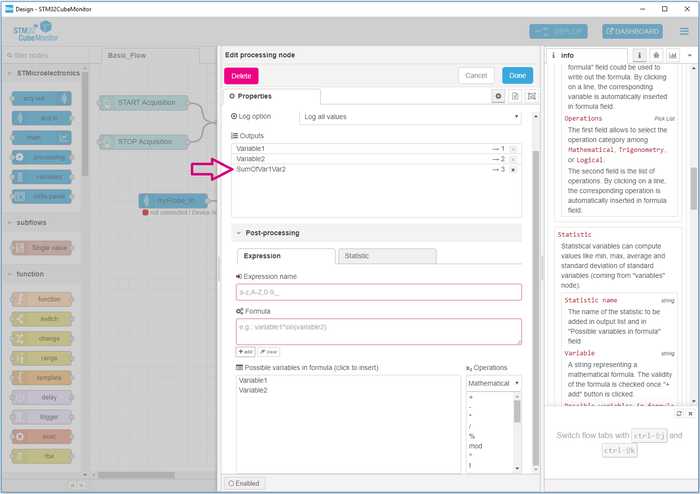
Here are the steps to perform the sum of 2 variables:
1. Fill the field Expression name, in this example "SumOfVar1Var2".
2. Write your formula directly in the field Formula, or by using the operations pick-list and double-clicking on the available variables. (It is also possible to type constant values in the formula. Hexadecimal values can be used with the syntax '0x12EF'.)
3. Clicking on the button +add to check the expression coherence and add it to the outputs list.
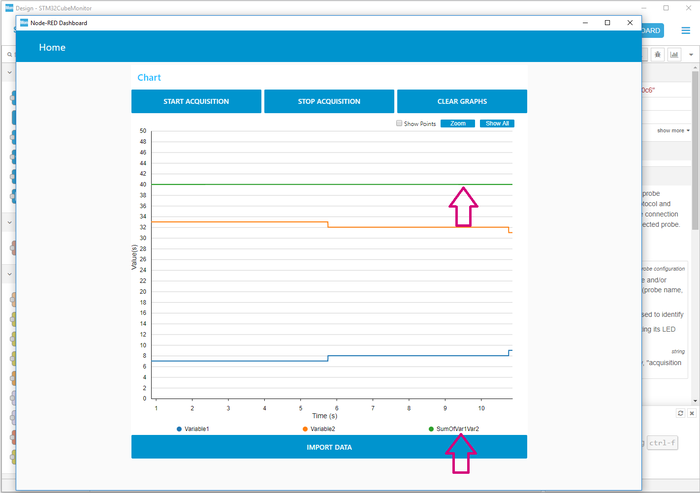
4. Deploying the flow to save the new configuration. When starting an acquisition, the new expression is calculated and is visible, like the other variables.
2. Example expression bitwise
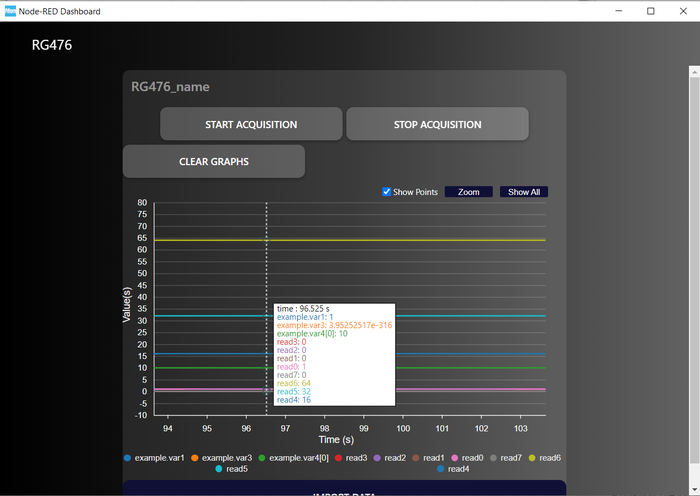
An example of the readbits(a,n) operation.
Lets create new expressions where :
read0 = readBit_n('0x71',0),
read1 = readBit_n('0x71',1),
...
read7 = readBit_n('0x71',7)
0x71 in hexadecimal is equal to 0111 0001 in binary.
In the figure all expressions are calculated and showed in the graph.
3. Example statistic
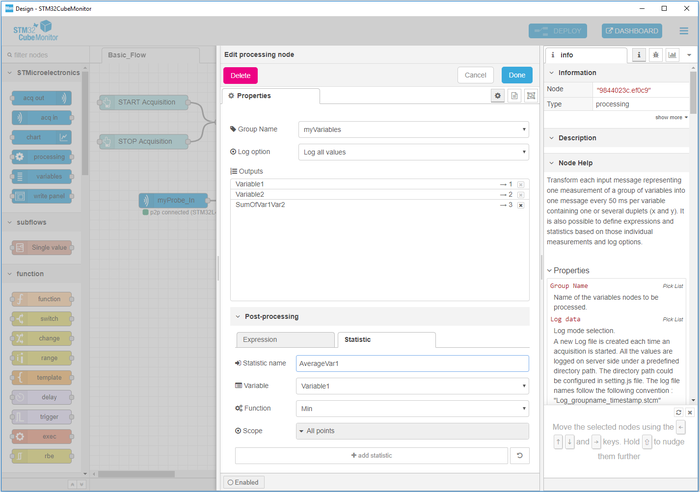
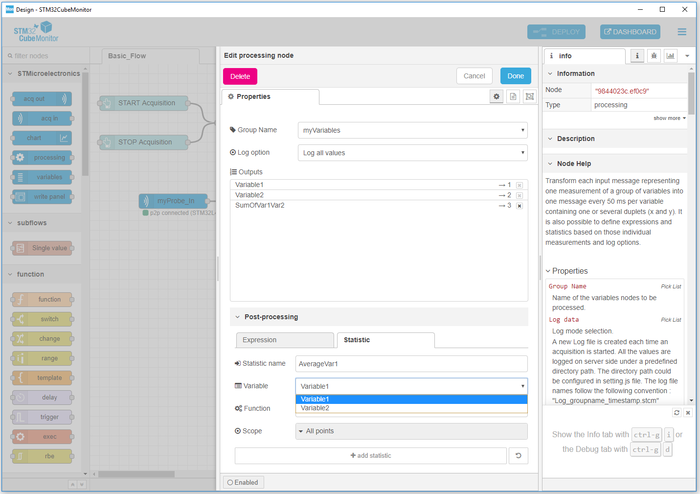
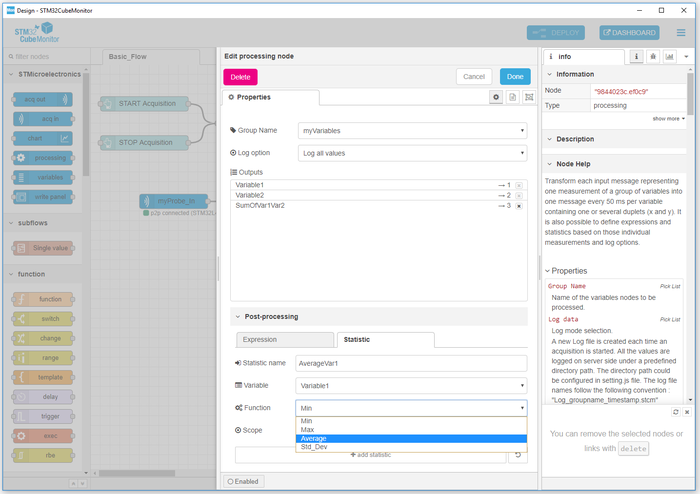
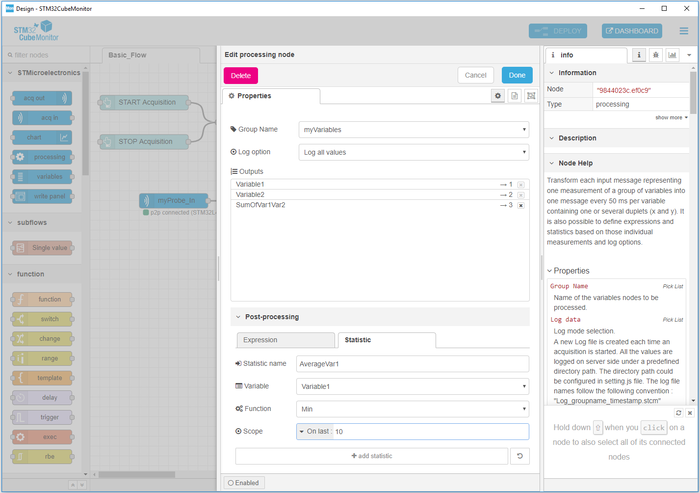
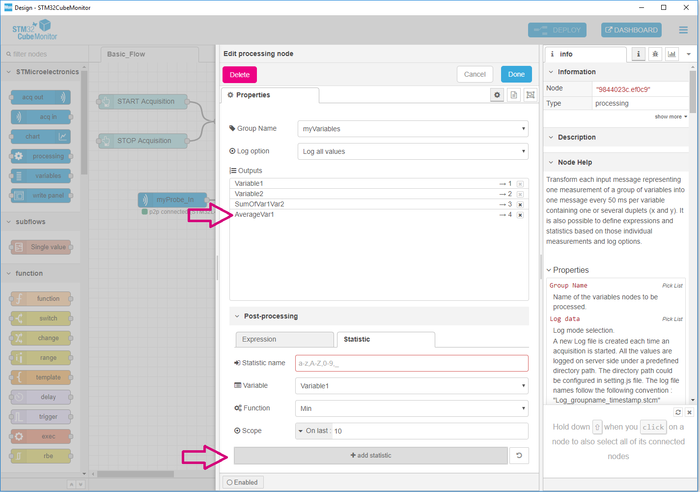
Here are the steps to perform the average of the 10 last read values of Variable1.
1. Fill the field Statistic name, in this example "AverageVar1".
2. Select the Variable, in this example "Variable1".
3. Select the Function, in this example "Average".
4. Select the Scope, in this example, the average of the 10 last values read.
5. Click on the button +add statistic to add the statistic to outputs.
6. Deploying the flow to save the new configuration. When an acquisition starts, the new statistic is calculated and is visible like the other variables.
