1. Article Purpose[edit source]
This article provides the basic information needed to start using the Linux® monitoring tool: netdata[1].
2. Introduction[edit source]
The following table provides a brief description of the tool, as well as its availability depending on the software packages:
![]() : this tool is either present (ready to use or to be activated), or can be integrated and activated on the software package.
: this tool is either present (ready to use or to be activated), or can be integrated and activated on the software package.
![]() : this tool is not present and cannot be integrated, or it is present but cannot be activated on the software package.
: this tool is not present and cannot be integrated, or it is present but cannot be activated on the software package.
| Tool | STM32MPU Embedded Software distribution | STM32MPU Embedded Softwaredistribution for Android™ | ||||||
|---|---|---|---|---|---|---|---|---|
| Name | Category | Purpose | Starter Package | Developer Package | Distribution Package | Starter Package | Developer Package | Distribution Package |
| netdata | Monitoring tools | netdata[1] is a system for distributed real-time performance and health monitoring. It provides unparalleled insights, in real-time, of everything happening on the system it runs (including applications such as web and database servers), using modern interactive web dashboards. | ||||||
3. Installing the trace and debug tool on your target board[edit source]
3.1. Using the STM32MPU Embedded Software distribution[edit source]
netdata is installed by default and ready to be used with all STM32MPU Embedded Software Packages.
 which netdata
/usr/sbin/netdata
It is integrated in weston image distribution through meta-st package: meta-st/meta-st-openstlinux/recipes-st/packagegroups/packagegroup-framework-tools.bb.
RDEPENDS_packagegroup-framework-tools-ui = "\
   ${@bb.utils.contains('DISTRO_FEATURES', 'x11', 'xvinfo', , d)}    \
   ${@bb.utils.contains('DISTRO_FEATURES', 'gplv3', 'glmark2', , d)} \
   ${@bb.utils.contains('DISTRO_FEATURES', 'gplv3', 'netdata', , d)} \
   ${@bb.utils.contains('DISTRO_FEATURES', 'gplv3', 'lmsensors-libsensors', , d)} \
   "
4. Getting started[edit source]
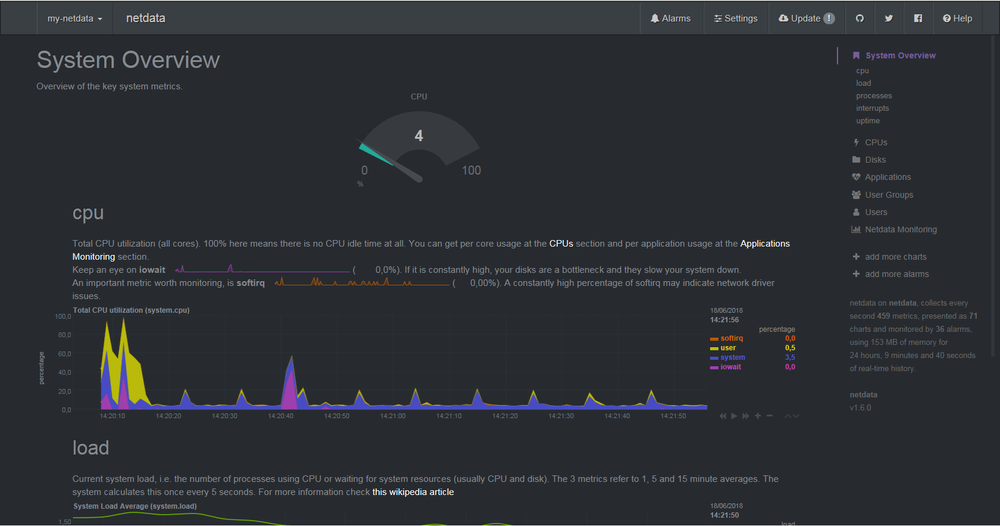
netdata provides all monitoring information on a web page accessible at the IP address of the board.
It proposes a default web page, on port 19999. It is also possible to create a custom page.
4.1. netdata service[edit source]
netdata is managed as a service. In OpenSTLinux distribution, it can be found under meta-st/meta-st-openstlinux/recipes-webadmin/netdata/netdata/netdata.service.
The following command allows to verify if the service is active and running on the target board:
 systemctl | grep netdata
  netdata.service                           loaded active running  Netdata, Real-time performance monitoring
In case it is not running, the service can be started using the following command:
systemctl start netdata
It is recommended to stop the service when it is not needed any longer:
systemctl stop netdata
4.2. Generic netdata web page[edit source]
On host PC browser, the generic netdata web page is found at address:
http://<ip_of_board>:19999

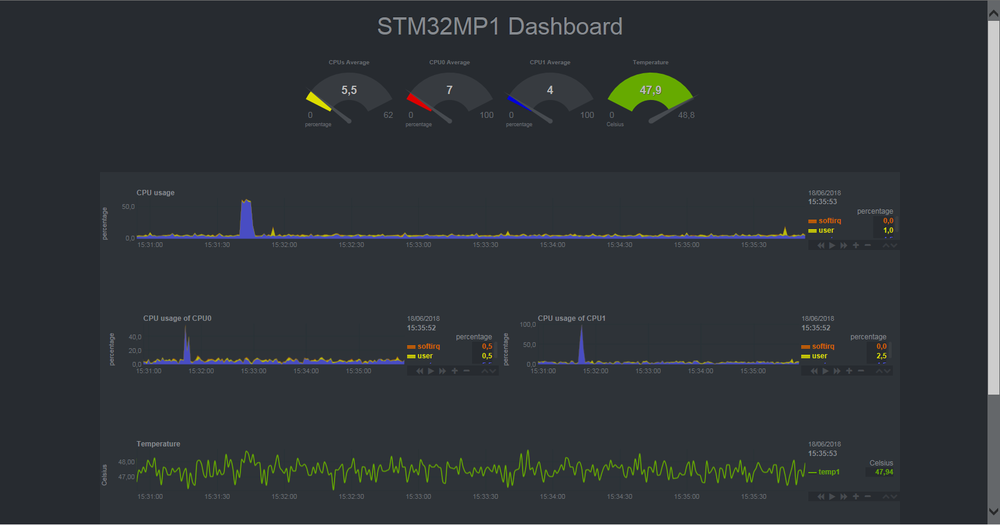
4.3. Customized netdata web page[edit source]
A customized web page is proposed in OpenSTLinux environment to monitor some specific indicators: STM32MP1 Dashboard
- Starter and Developer Packages
- - directly accessible on the target under:
/usr/share/netdata/web/stm32.html
- Distribution Package
- - available under recipes-webadmin directory in file:
meta-st/meta-st-openstlinux/recipes-webadmin/netdata/netdata/stm32.html
On host PC browser, it is available at address:
http://<ip_of_board>:19999/stm32.html

5. References[edit source]
- Useful external links
| Document link | Document Type | Description |
|---|---|---|
| netdata source and documentation page | Standard | GitHub link reference |