Template:ArticleBasedOnModel Template:ArticleMainWriter
Template:ArticleApprovedVersion
1. Article purpose[edit source]
This article provides basic information needed to start using the Linux® kernel tool: perf[1].
2. Introduction[edit source]
The following table provides a brief description of the tool, as well as its availability depending on the software packages:
Template:Y: this tool is either present (ready to use or to be activated), or can be integrated and activated on the software package.
Template:N: this tool is not present and cannot be integrated, or it is present but cannot be activated on the software package.
| Tool | STM32MPU Embedded Software distribution | STM32MPU Embedded Software distribution for Android™ | ||||||
|---|---|---|---|---|---|---|---|---|
| Name | Category | Purpose | Starter Package | Developer Package | Distribution Package | Starter Package | Developer Package | Distribution Package |
| perf | Monitoring tools | perf[1] is a Linux user space tool, which allows getting system performance figures | Template:Y | Template:Y | Template:Y | Template:UnderConstruction | ||
3. Installing the trace and debug tool on your target board[edit source]
3.1. Using the STM32MPU Embedded Software distribution[edit source]
perf is installed by default and ready to be used in all the STM32MPU Embedded Software Packages.
Template:Board$ which perf
/usr/bin/perf
It is integrated in the weston image distribution through openembedded-core package: openembedded-core/meta/recipes-core/packagegroups/packagegroup-core-tools-profile.bb.
RRECOMMENDS_${PN} = "\
   Template:Green \
   trace-cmd \
   blktrace \
   ${PROFILE_TOOLS_X} \
   ${PROFILE_TOOLS_SYSTEMD} \
   "
...
PERF = "Template:Green"
3.2. Using the STM32MPU Embedded Software distribution for Android™[edit source]
4. Getting started[edit source]
4.1. Perf commands[edit source]
usage: perf [--version] [--help] [OPTIONS] COMMAND [ARGS]

The most commonly used perf commands are:
  annotate        Reads perf.data (created by perf record) and displays annotated code
  archive         Creates archive with object files with build-ids found in perf.data file
  bench           General framework for benchmark suites
  buildid-cache   Manages build-id cache.
  buildid-list    Lists the buildids in a perf.data file
  c2c             Shared Data C2C/HITM Analyzer.
  config          Gets and sets variables in a configuration file.
  data            Data file related processing
  diff            Reads perf.data files and displays the differential profile
  evlist          Lists the event names in a perf.data file
  ftrace          simple wrapper for kernel's ftrace functionality
  inject          Filters to augment the events stream with additional information
  kallsyms        Searches running kernel for symbols
  kmem            Tool to trace/measure kernel memory properties
  kvm             Tool to trace/measure kvm guest os
  list            Lists all symbolic event types
  lock            Analyzes lock events
  mem             Profiles memory accesses
  record          Runs a command and records its profile into perf.data
  report          Reads perf.data (created by perf record) and displays the profile
  sched           Tool to trace/measure scheduler properties (latencies)
  script          Reads perf.data (created by perf record) and displays trace output
  stat            Runs a command and gathers performance counter statistics
  test            Runs sanity tests.
  timechart       Tool to visualize total system behavior during a workload
  top             System profiling tool.
  probe           Defines new dynamic tracepoints

See 'perf COMMAND -h' for more information on a specific command.
4.2. Most useful commands with simple to use interface[edit source]
- perf top (Linux kernel documentation[2]): provides the CPU load by counting the number of cycles events; the default order is descending the number of samples per symbol:
Template:Board$ perf top
 40.62%  [kernel]                           [k] v7_dma_inv_range
 18.65%  [kernel]                           [k] _raw_spin_unlock_irqrestore
 17.01%  [kernel]                           [k] arch_cpu_idle
  8.27%  [kernel]                           [k] v7_dma_clean_range
  5.00%  [kernel]                           [k] rcu_idle_exit
  1.70%  [kernel]                           [k] cpu_startup_entry
  0.52%  [kernel]                           [k] trace_graph_return
  0.48%  [kernel]                           [k] finish_task_switch
  0.48%  libc-2.18.so                       [.] memcpy
  0.47%  [kernel]                           [k] trace_graph_entry
- Means that CPU is spending 40% of time in function v7_dma_inv_range, and 18.65% in _raw_spin_unlock_irqrestore.
- More information and examples are available in perf.wiki.kernel.org[3]
- This is also possible to display the result in a specified sorting:
Usage: perf top [<options>]
   -s, --sort <key[,key2...]>
              sort by key(s): pid, comm, dso, symbol, parent, cpu, srcline, ... Please refer to the main page for the complete list.
- perf stat (Linux kernel documentation[4]): obtains event counts
Template:Board$ perf stat hello_world_example
User space example: hello world from STMicroelectronics
10 9 8 7 6 5 4 3 2 1 0
User space example: goodbye from STMicroelectronics

Performance counter stats for 'hello_world_example':

         4.328249      task-clock (msec)         #    0.000 CPUs utilized
               11      context-switches          #    0.003 M/sec
                0      cpu-migrations            #    0.000 K/sec
               38      page-faults               #    0.009 M/sec
          2710036      cycles                    #    0.626 GHz
           640856      instructions              #    0.24  insn per cycle
            75644      branches                  #   17.477 M/sec
            21764      branch-misses             #   28.77% of all branches

     11.109859338 seconds time elapsed
- More information and examples are available in perf.wiki.kernel.org[5].
- perf list (Linux kernel documentation[6]): supported symbolic event types
Template:Board$ perf list
 branch-instructions OR branches                    [Hardware event]
 branch-misses                                      [Hardware event]
 bus-cycles                                         [Hardware event]
 cache-misses                                       [Hardware event]
 cache-references                                   [Hardware event]
 cpu-cycles OR cycles                               [Hardware event]
 instructions                                       [Hardware event]
 alignment-faults                                   [Software event]
 bpf-output                                         [Software event]
 context-switches OR cs                             [Software event]
 cpu-clock                                          [Software event]
 cpu-migrations OR migrations                       [Software event]
 dummy                                              [Software event]
 emulation-faults                                   [Software event]
 major-faults                                       [Software event]
 minor-faults                                       [Software event]
 page-faults OR faults                              [Software event]
 task-clock                                         [Software event]
 L1-dcache-load-misses                              [Hardware cache event]
 L1-dcache-loads                                    [Hardware cache event]
 L1-dcache-store-misses                             [Hardware cache event]
 L1-dcache-stores                                   [Hardware cache event]
 L1-icache-load-misses                              [Hardware cache event]
 L1-icache-loads                                    [Hardware cache event]
 LLC-load-misses                                    [Hardware cache event]
 LLC-loads                                          [Hardware cache event]
 LLC-store-misses                                   [Hardware cache event]
 LLC-stores                                         [Hardware cache event]
 branch-load-misses                                 [Hardware cache event]
 branch-loads                                       [Hardware cache event]
 dTLB-load-misses                                   [Hardware cache event]
 dTLB-store-misses                                  [Hardware cache event]
 iTLB-load-misses                                   [Hardware cache event]
 armv7_cortex_a7/br_immed_retired/                  [Kernel PMU event]
 armv7_cortex_a7/br_mis_pred/                       [Kernel PMU event]
 armv7_cortex_a7/br_pred/                           [Kernel PMU event]
 armv7_cortex_a7/br_return_retired/                 [Kernel PMU event]
 armv7_cortex_a7/bus_access/                        [Kernel PMU event]
 armv7_cortex_a7/bus_cycles/                        [Kernel PMU event]
 armv7_cortex_a7/cid_write_retired/                 [Kernel PMU event]
 armv7_cortex_a7/cpu_cycles/                        [Kernel PMU event]
 armv7_cortex_a7/exc_return/                        [Kernel PMU event]
 armv7_cortex_a7/exc_taken/                         [Kernel PMU event]
 armv7_cortex_a7/inst_retired/                      [Kernel PMU event]
 armv7_cortex_a7/inst_spec/                         [Kernel PMU event]
 armv7_cortex_a7/l1d_cache/                         [Kernel PMU event]
 armv7_cortex_a7/l1d_cache_refill/                  [Kernel PMU event]
 armv7_cortex_a7/l1d_cache_wb/                      [Kernel PMU event]
 armv7_cortex_a7/l1d_tlb_refill/                    [Kernel PMU event]
 armv7_cortex_a7/l1i_cache/                         [Kernel PMU event]
 armv7_cortex_a7/l1i_cache_refill/                  [Kernel PMU event]
 armv7_cortex_a7/l1i_tlb_refill/                    [Kernel PMU event]
 armv7_cortex_a7/l2d_cache/                         [Kernel PMU event]
 armv7_cortex_a7/l2d_cache_refill/                  [Kernel PMU event]
 armv7_cortex_a7/l2d_cache_wb/                      [Kernel PMU event]
 armv7_cortex_a7/ld_retired/                        [Kernel PMU event]
 armv7_cortex_a7/mem_access/                        [Kernel PMU event]
 armv7_cortex_a7/memory_error/                      [Kernel PMU event]
 armv7_cortex_a7/pc_write_retired/                  [Kernel PMU event]
 armv7_cortex_a7/st_retired/                        [Kernel PMU event]
 armv7_cortex_a7/sw_incr/                           [Kernel PMU event]
 armv7_cortex_a7/ttbr_write_retired/                [Kernel PMU event]
 armv7_cortex_a7/unaligned_ldst_retired/            [Kernel PMU event]
 rNNN                                               [Raw hardware event descriptor]
 cpu/t1=v1[,t2=v2,t3 ...]/modifier                  [Raw hardware event descriptor]
 mem:<addr>[/len][:access]                          [Hardware breakpoint]
 alarmtimer:alarmtimer_cancel                       [Tracepoint event]
 alarmtimer:alarmtimer_fired                        [Tracepoint event]
 alarmtimer:alarmtimer_start                        [Tracepoint event]
 alarmtimer:alarmtimer_suspend                      [Tracepoint event]
 asoc:snd_soc_bias_level_done                       [Tracepoint event]
 asoc:snd_soc_bias_level_start                      [Tracepoint event]
 asoc:snd_soc_dapm_connected                        [Tracepoint event]
 asoc:snd_soc_dapm_done                             [Tracepoint event]
 asoc:snd_soc_dapm_path                             [Tracepoint event]
 asoc:snd_soc_dapm_start                            [Tracepoint event]
 asoc:snd_soc_dapm_walk_done                        [Tracepoint event]
 asoc:snd_soc_dapm_widget_event_done                [Tracepoint event]
 asoc:snd_soc_dapm_widget_event_start               [Tracepoint event]
...
 xhci-hcd:xhci_inc_enq                              [Tracepoint event]
 xhci-hcd:xhci_queue_trb                            [Tracepoint event]
 xhci-hcd:xhci_ring_alloc                           [Tracepoint event]
 xhci-hcd:xhci_ring_expansion                       [Tracepoint event]
 xhci-hcd:xhci_ring_free                            [Tracepoint event]
 xhci-hcd:xhci_setup_addressable_virt_device        [Tracepoint event]
 xhci-hcd:xhci_setup_device                         [Tracepoint event]
 xhci-hcd:xhci_setup_device_slot                    [Tracepoint event]
 xhci-hcd:xhci_stop_device                          [Tracepoint event]
 xhci-hcd:xhci_urb_dequeue                          [Tracepoint event]
 xhci-hcd:xhci_urb_enqueue                          [Tracepoint event]
 xhci-hcd:xhci_urb_giveback                         [Tracepoint event]
- perf record (Linux kernel documentation[7]): records events for later reporting
Template:Board$ perf record hello_world_example

User space example: hello world from STMicroelectronics
10 9 8 7 6 5 4 3 2 1 0
User space example: goodbye from STMicroelectronics
[ perf record: Woken up 1 time to write data ]
[ perf record: Captured and wrote 0.004 MB perf.data (28 samples) ]
- Template:Highlight (given by perf list command). More information, options and examples are available in perf.wiki.kernel.org[8].
- By default, the events are recorded in the perf.data file. Template:Highlight.
- perf report (Linux kernel documentation[9]): breaks down the events by process, function, etc.
Example after previous command "perf record hello_world_example"
Template:Board$ perf report
Samples: 28  of event 'cycles:ppp', Event count (approx.):2737925
Overhead  Command          Shared Object Symbol
  12.66%  hello_world_exa  ld-2.26.so         [.] _dl_relocate_object
  11.71%  hello_world_exa  [kernel.kallsyms]  [k] filemap_map_pages
  10.65%  hello_world_exa  [kernel.kallsyms]  [k] n_tty_write
   6.43%  hello_world_exa  [kernel.kallsyms]  [k] percpu_counter_add_batch
   6.43%  hello_world_exa  ld-2.26.so         [.] sbrk
   6.24%  hello_world_exa  [kernel.kallsyms]  [k] cpu_v7_set_pte_ext
   5.56%  hello_world_exa  [kernel.kallsyms]  [k] alloc_set_pte
   5.56%  hello_world_exa  libc-2.26.so       [.] __sbrk
   5.37%  hello_world_exa  [kernel.kallsyms]  [k] __vma_link_file
   5.32%  hello_world_exa  [kernel.kallsyms]  [k] __fput
   5.32%  hello_world_exa  [kernel.kallsyms]  [k] ldsem_up_read
   5.32%  hello_world_exa  [kernel.kallsyms]  [k] unmap_page_range
   5.32%  hello_world_exa  libc-2.26.so       [.] printf
   5.24%  hello_world_exa  [kernel.kallsyms]  [k] _raw_spin_unlock_irqrestore
   2.23%  hello_world_exa  [kernel.kallsyms]  [k] perf_event_mmap
   0.48%  hello_world_exa  [kernel.kallsyms]  [k] perf_output_begin
   0.13%  perf             [kernel.kallsyms]  [k] perf_event_exec
- By default, report file perf.data is read as input file. Template:Highlight.
- More information and examples are available in perf.wiki.kernel.org[10].
- perf bench (Linux kernel documentation[11]): runs different kernel microbenchmarks:
# List of all available benchmark collections:

        sched: Scheduler and IPC benchmarks
          mem: Memory access benchmarks
        futex: Futex stressing benchmarks
          all: All benchmarks
Example of getting memcpy benchmark for 100MB:
Template:Board$ perf bench mem memcpy --size 100MB
# Running 'mem/memcpy' benchmark:
# function 'default' (Default memcpy() provided by glibc)
# Copying 100MB bytes ...

       1.426138 GB/sec
- More information and examples are available in perf.wiki.kernel.org[12].
5. To go further[edit source]
5.1. Visualizing trace using Flame Graphs[edit source]
As part of Flame Graphs[13], this is possible to visualize trace coming from perf.
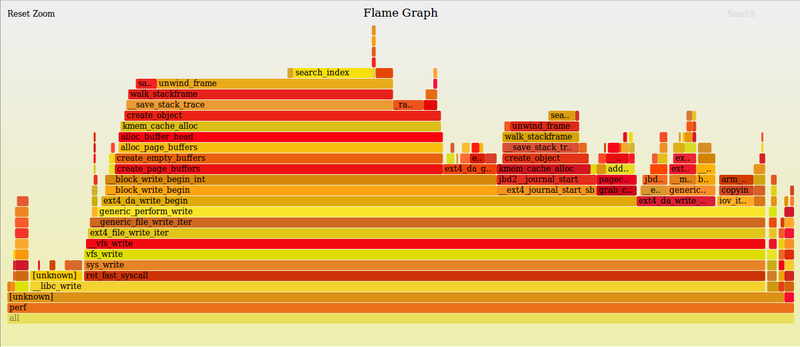
The Flame graphs are generated using Flame graphs tool suite[14].
- Install the Flame Graph tool suite on host PC side
Template:PC$ cd Template:Orange
Template:PC$ git clone https://github.com/brendangregg/FlameGraph.git
Template:PC$ cd FlameGraph
- Generate a Flame graph from perf tool
- When generating perf record, Template:Highlight.
As example for a top command:
- Perform perf record command on board side
Template:Board$ perf record -a -g top
Template:Board$ perf script > perf_top.out

- Copy perf_top.out on your host PC (i.e. in the FlameGraph directory)

- Perform the flame graph generation on host PC side using stackcollapse-perf.pl script
Template:PC$ ./stackcollapse-perf.pl perf_top.out > out.top_folded

- Use flamegraph.pl to render a SVG (Scalable Vector Graphics) file.
Template:PC$ ./flamegraph.pl out.top_folded > top.svg

- Visualize SVG using web browser for example
Template:PC$ firefox top.svg
6. References[edit source]
- ↑ 1.0 1.1 https://perf.wiki.kernel.org/index.php/Main_Page
- ↑ Template:CodeSource
- ↑ https://perf.wiki.kernel.org/index.php/Tutorial#Live_analysis_with_perf_top
- ↑ Template:CodeSource
- ↑ https://perf.wiki.kernel.org/index.php/Tutorial#Counting_with_perf_stat
- ↑ Template:CodeSource
- ↑ Template:CodeSource
- ↑ https://perf.wiki.kernel.org/index.php/Tutorial#Sampling_with_perf_record
- ↑ Template:CodeSource
- ↑ https://perf.wiki.kernel.org/index.php/Tutorial#Sample_analysis_with_perf_report
- ↑ Template:CodeSource
- ↑ https://perf.wiki.kernel.org/index.php/Tutorial#Benchmarking_with_perf_bench
- ↑ http://www.brendangregg.com/flamegraphs.html
- ↑ https://github.com/brendangregg/FlameGraph
- Useful external links
| Document link | Document Type | Description |
|---|---|---|
| perf tutorial | User Guide | perf.wiki.kernel.org |
| perf (wikipedia.org) | Standard | wikipedia.org |
| Brendan Gregg's perf page | Perf example | From Brendan Gregg |
| Eclipse perf plugin page | Eclipse perf plugin | Eclipse.org |
Arm® is a registered trademark of Arm Limited (or its subsidiaries) in the US and/or elsewhere. ![]()