This page provides help with the most common questions about STM32CubeMonitor.
1. Where to download STM32CubeMonitor
All required resources are available on www.st.com : STM32CubeMonitor
2. Is there a "getting started" tutorial ?
There is a video explaining how to start an acquisition flow. It is visible on Youtube : "Getting started" video
3. Is it possible to add external nodes
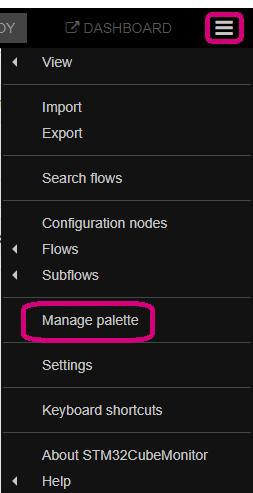
Of course, you can add external nodes to your palette via the menu "Manage palette".
You may not see the menu because Node-Red uses npm to install nodes, and the menu "Manage Palette" is not available when npm is not installed on the computer. In order to add nodes in the palette, you need to install nodejs (with npm). Then the menu will be available, you will have access to Node-RED nodes.
4. Is it possible to write variable(s) programmatically without write widget
To write data by flow, the following payload must be sent to probe out node ,with the topic “write” :
 {
   "variablelist": [
        {
            "address": "0x20000060",
            "type": 4,
            "value": "xxxx"
        }
    ],
    "accesspoint": 0
 }
One possible flow with standard nodes, look like:
where a slider has been added to generate the value (but can be done by any node) then the template node (wrtite_msg) formats the payload, and the change node sets the topic.
Template node content :
The variable address and variable type must be filled here. For the type and address, the easiest way is to try first with a writing panel and a debug node, and see the values. The payload value from the input will be inserted in the template. (the value to write).
The next node is a “change” to set the topic to write:
5. Is there a way to plot arbitrary variable like STMStudio "point viewer"
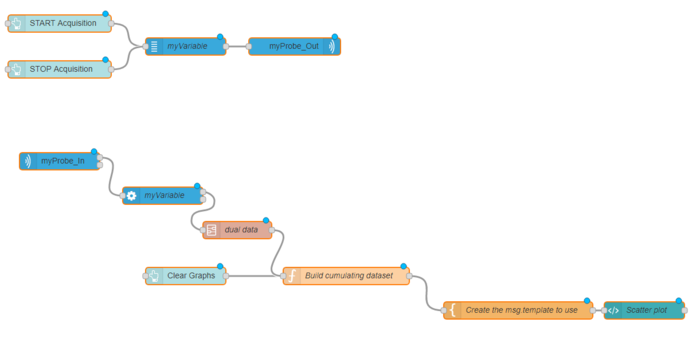
Find hereafter a flow where the variable "counter" as X and "counter2" as Y are displayed in a scatter graph.
You will have to modify the configuration of nodes "variables" (select your own variables), "acquisition out" - "acquisition in" (select your own probe), "processing" (select the variables node) and configure "dual data" subflow to select the mapping X and Y with your own variables.
Please find hereafter the flow to import: point viewer flow
6. Is it possible to automate testing of the running code like a batch?
There is no batch mode, but you can automate monitoring with flows. Node-RED provides many useful nodes to create your own flows. (ie there is some sequencer nodes to manage sequences in the flows)
7. Does digital field-buses (e.g. CAN) can be interpreted?
There are various nodes related to CAN, but no node is directly processing can data. Some are processing data coming from linux CanSocket, or other are receiving in MQTT format from CAN decoders. Decoding CAN bus on the fly will be nearly impossible. But if data are decoded in the STM32 and then stored in buffer, it should be feasible to get the CAN data. Using the snapshot mode and calling the dump function when data are received should be quite efficient.
8. How to filter or route variable to UI?
The “single value” subflow allows to send data in a gauge but not in a chart, here are the solutions to perform a monitoring of multiple values with several UI.
Several solutions can perform this routing or filtering:
- You can create 2 different groups of variables (variable nodes), and consequently the same amount of processing nodes. One can be connected to the gauge and the other one to the chart.
- You can use the “switch node”, used like a filtering node on the output of the processing node. The switch node, filters your variable on the following property : msg.payload.variablename and set == myVariable.
Here is the switch node configuration :
   [{
       "id": "2ca79e6f.a68e72",
       "type": "switch",
       "z": "8bf74b4c.0fa5f8",
       "name": "filter variable",
       "property": "payload.variablename",
       "propertyType": "msg",
       "rules": [
           {
               "t": "eq",
               "v": "myVariable",
               "vt": "str"
           }
       ],
       "checkall": "true",
       "repair": false,
       "outputs": 1,
       "x": 630,
       "y": 220,
       "wires": [
           [
               "b9d7ae86.0da72"
           ]
       ]
   } ]
You first have to import it into your STM32CubeMonitor tool following these steps :
- Click on the “Hamburger” menu, at the top right of your window
- Select “Import”
- In “Clipboard” paste your json configuration and click on “Import”
The switch node will automatically appear in your design window. Link it to your processing node output.
In the switch node configuration panel, replace “myVariable” by the variable name you want to filter.
You can either use several “switch nodes” in series or in parallels to filter multiple variables :
8.1. "Switch nodes" in series
In the previous flow, the first switch node allows to route the "counter" variable to a new chart. The second switch node allows to plot all remaining variables in the other chart excluding only one variable.
8.2. "Switch nodes" in parallel
In the previous flow, the first switch node allows to route all variables except the counter value. The second switch node allows to route only the counter variable to a new chart.

