1. Demo description
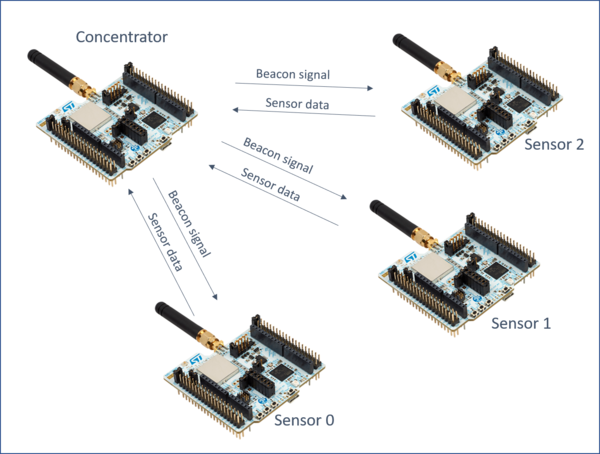
The demo shows data from wireless sensor connected to a concentrator. The sensors and the concentrator are based on STM32WL boards. The concentrator is connected with serial port to STM32CubeMonitor to display the data from sensors. There is one concentrator, and up to 15 sensors. When the demo starts, the concentrator is configured with the region information to select the correct frequency to use. then, the concentrator will broadcast beacons to synchronize the sensors. Then sensor will send the data (voltage, temperature) periodically.
2. How to use the Demo
2.1. Configuration
2.1.1. Board configuration
The software "concentrator.bin" must be loaded in the concentrator. The concentrator must be connected to computer with an usb cable. The sensors devices must be loaded with software "sensor.bin".
2.1.2. STM32CubeMonitor configuration
- The version 1.1.0 or above of STM32CubeMonitor is required. It can be downloaded on www.st.com/stm32cubemonitor . Detailed instruction are in the wiki.
- Import the Wireless Long range Demo flow. go in the top right menu, select import, then "select a file to import" and open the demo.json file.
- Remove the default flow (Basic_Flow). double click on the "Basic_Flow" tab to pen the properties, and click on "delete" button.
- Click on DEPLOY button
2.1.3. Connection to computer
Connect the concentrator board to the computer. Open the the "Serial port configuration" tab. This tab is used to configure the serial port
Open the node « SERIAL IN » and click on the pencil to edit the Serial Port configuration. Click on the search icon at right of “Serial Port” box, to display the list of connected serial port. Select the concentrator COM port. Set the baud rate to 9600 Bps. Other parameters don’t need to be changed. Click on “Add/Update” button : the port Serial-port configuration is ready. Open the node “SERIAL OUT” and check the Serial-port configuration. The serial port is configured. Click on DEPLOY button
2.2. Start the demo
Open the demo with “Dashboard” button.
Select the Region and subRegion and then press start. The sensor list is displayed and will be updated when data are received.
2.3. Data visualization
The list of sensors detected and the data collected are displayed in the Sensor List. For each sensor a "Sensor panel" will display charts. The serial log panel show the AT commands exchanged with the concentrator.
2.3.1. The sensor List
For each sensor, the table shows :
- EUI : Sensor unique identifier
- Packets received : Number of packets received from this sensor
- Packets missed : The sensor increases the packet ID for each packet sent. If there is a gap between previous packet Id and the current one, it means some packets have been lost. This is counted in "missed packets".
- RSSI : Received Signal Strength Indicator : show the level of power received
- PER : Packet Error Rate : Gives the % of lost packets. 0 if perfect.
- SNR : Signal to Noise Ratio : give an indication of signal quality. High value are better.
- Temp : Sensor temperature value. (Use STM32 internal sensor)
- Voltage : Power supply voltage. Should be arround 3.3V when board is usb powered.
The "COUNTER RESET" button set to 0 the received packets, the missed packets and the PER.
The "RESTART" button allows to reset the concentrator and goes back to Region selection page.
2.3.2. Serial log panel :
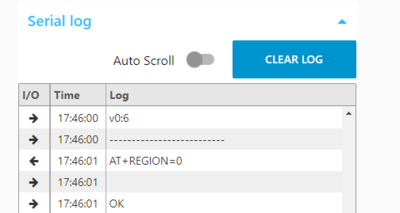
The Serial port log shows the AT commands sent to the concentrator (left arrow), and the answers (right arrow). The time stamp is the local time.
When the Auto Scroll switch is on, the log will scroll down automatically to display the new lines received. The button clear Log will empty the log windows.
2.3.3. Sensor panels :
The "Sensor x" panels are added when sensors are detected. The panels can be opened by clicking on the sensor list or with the blue arrows on the top right of the panels. Each Panel shows the temperature and the RSSI values in a chart and display the voltage in a gauge.
3. Explaining the flow
3.1. Demo main flow
blabla
3.2. AT command flow
blabla
blabla autre panels
3.3. AT commands details
AT commands listed below are sent to emitter and receiver
3.3.1. Concentrator reset and config :
ATZ : Reset the board. AT+REGION=x : define the region. AT+SUBREGION=x : define the subregion. AT+BEACON_ON : start the beacon broadcast. AT+LIST_REGIONS : Print list of all available regions and subregions.
3.3.2. sensor status :
The concentrator send the data received from sensors in notifications AT+RCV. i.e. : AT+RCV=0x00004e1c,0x10,0:6,-35,6,+30.00,3.30 Format :
- AT+RCV=
- 0x00004e1c : Sensor EUI
- 0x10 : number of packet transmitted by the sensor.
- -35 : RSSI level
- 6 : SNR
- +30.00 : sensor temperature (inside MCU)
- 3.30 : sensor voltage


