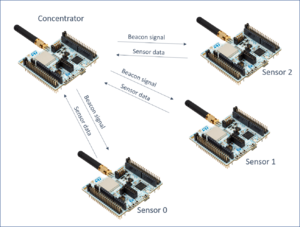
1. Demo description
The demo shows data from wireless sensor connected to a concentrator. The sensors and the concentrator are based on STM32WL boards. The concentrator is connected with serial port to STM32cubeMonitor to display the data from sensors. There is one concentrator, and up to 15 sensors. When the demo starts, the concentrator is configured with the region information to select the correct frequency to use. then, the concentrator will brodcast beacons to synchronize the sensors. Then sensor will send the data (voltage, temperature) periodically.
2. Explaining the dashboard
2.1. Board configuration
The software "concentrator.bin" must be loaded in the concentrator. The concentrator must be connected to computer with an usb cable.
The sensors devices must be loaded with software "sensor.bin"
2.2. Connection to computer
Connect the concentrator board to the computer. In the "UART configuration" tab, select the COM port Open the node « SERIAL IN » and click on the pencil to edit the Serial Port configuration. Click on the search icon at right of “Serial Port” box, to display the list of connected uart. Select the concentrator COM port. Set the baud rate to 9600 Bps. Other parameters don’t need to be changed. Click on “Add/Update” button : the port Serial-port configuration is ready. Open the node “SERIAL OUT” and check the Serial-port configuration. The serial port is configured.
2.3. Start the demo
Open the demo with “Dashboard” button. Select the Region and subRegion and then press start. The sensor list is displayed and will be updated when data are received.
2.4. Sensor List :
Each detected sensor is added in the list, and information are updated :
-  EUI : Sensor unique identifier
-  Packets received : Number of packets received from this sensor
-  Packets missed : The sensor increases the packet ID for each packet sent. If there is a gap between previous packet Id and the current one, it means some packets have been lost. This is counted in "missed packets".
-  RSSI : Received Signal Strength Indicator : show the level of power received
-  PER : Packet Error Rate : Gives the % of lost packets. 0 if perfect.
-  SNR : Signal to Noise Ratio : give an indication of signal quality. High value are better.
-  Temp : Sensor temperature value. (Use STM32 internal sensor)
-  Voltage : Power supply voltage.  Should be arround 3.3V when board is usb powered.
The "COUNTER RESET" button set to 0 the received packets, the missed packets and the PER. The "RESTART" button allows to reset te concentrator and goes back to Region selection page.
2.5. Serial log :
The Serial port log shows the AT commands sent to the concentrator (left arrow), and the answers (right arrow).
2.6. Sensor panels :
Some "Sensor x" panels are added when sensors are detected. The panels can be opened by clicking on the sensor list or with the blue arrows on the right of the panels. Each Panel shows temperature and RSSI value history in a chart and display the voltage in a gauge.
3. Explaining the flow
3.1. Demo main flow
blabla
3.2. AT command flow
blabla
blabla autre panels
4. AT commands details
AT commands listed below are sent to emitter and receiver
4.1. Concentrator reset and config :
ATZ Reset the board
AT+TCONF[=freq:pow:bw:sf:cr:lna:pa][=868000000:14:4:12:4/5:0:0:1:16:25000:2:3] for example. Sets the config for RF test.
AT+TTONE Start the TX transmission
AT+TOFF Stop the TX transmission
4.2. concentrator status :
AT+Z Reset
AT+TCONF[=freq:pow:bw:sf:cr:lna:pa][=868000000:14:4:12:4/5:0:0:1:16:25000:2:3] for example. Sets the config LoRa RF test.
AT+TRRSSI Start the RX reception and RSSI measurement
AT+TOFF Stop the RX reception
