| Coming soon |
1. Demo description
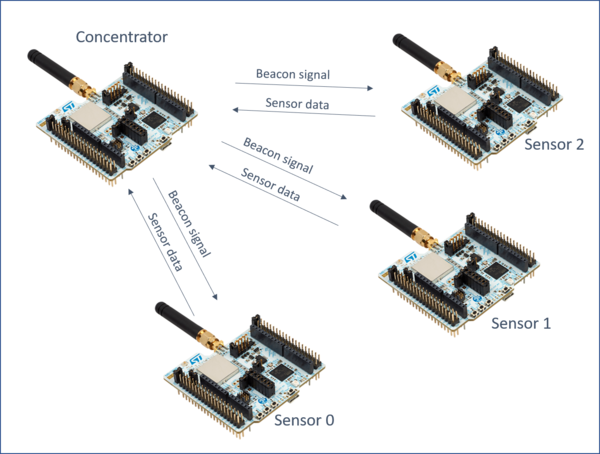
The demo shows data from wireless sensors connected to a concentrator. The sensors and the concentrator are based on STM32WL boards. The concentrator is connected with serial port to STM32CubeMonitor to display the data from sensors.
There is one concentrator, and up to 15 sensors.
When the demo starts, the concentrator is configured with the region information to select the correct frequency to use.
Then, the concentrator will broadcast beacons and the the sensors will send the data (voltage, temperature).
Beacons are short messages sent periodically by the concentrator to synchronize the sensors. Beacons allow the sensors to identify which band should be used, and when the data should be sent.
2. How to use the Demo
2.1. Configuration
2.1.1. Board configuration
The software "concentrator" must be loaded in the concentrator. The concentrator must be connected to computer with an usb cable.
The sensors devices must be loaded with software "sensor".
The Nucleo softwares are available in STM32CubeWL FW Package, in the path Projects\NUCLEO-WL55JC\Demonstrations\LocalNetwork\Concentrator and Projects\NUCLEO-WL55JC\Demonstrations\LocalNetwork\Sensor
2.1.2. STM32CubeMonitor configuration
- The version 1.1.0 or above of STM32CubeMonitor is required. It can be downloaded on www.st.com/stm32cubemonitor . Detailed instructions are in the wiki.
- Import the Wireless Long range Demo flow. Go in the top right menu, select import, then "select a file to import" and open the demo.json file.
- Remove the default flow (Basic_Flow). Double click on the "Basic_Flow" tab to open the properties, and click on "delete" button.
- Click on DEPLOY button
2.1.3. Connection to computer
Connect the concentrator board to the computer. Open the the "Serial port configuration" tab. This tab is used to configure the serial port
Open the « SERIAL IN » node and click on the pencil to edit the Serial Port configuration. Click on the search icon at right of “Serial Port” box, to display the list of connected serial port. Select the concentrator COM port. Set the baud rate to 9600 Bps. Other parameters don’t need to be changed. Click on “Add/Update” button : the Serial-port configuration is ready. Open the “SERIAL OUT” node and check the Serial-port configuration. The serial port is configured. Click on DEPLOY button
2.2. Start the demo
Open the demo with “Dashboard” button.
Select the Region and subRegion and then press start. The sensor list is displayed and will be updated when data are received.
2.3. Data visualization
The list of detected sensors and the collected data are displayed in the Sensor List. For each sensor a "Sensor panel" will display charts. The serial log panel shows the AT commands exchanged with the concentrator.
2.3.1. The sensor List
For each sensor, the table shows :
- EUI : Sensor unique identifier
- Packets received : Number of packets received from this sensor
- Packets missed : The sensor increases the packet ID for each packet sent. If there is a gap between previous packet Id and the current one, it means some packets have been lost. This is counted in "missed packets".
- RSSI : Received Signal Strength Indicator : Shows the level of power received
- PER : Packet Error Rate : Gives the % of lost packets. 0 if perfect.
- SNR : Signal to Noise Ratio : Gives an indication of signal quality. High value are better.
- Temp : Sensor temperature value. (Use STM32 internal sensor)
- Voltage : Power supply voltage. Should be arround 3.3V when board is usb powered.
The "COUNTER RESET" button sets to 0 the number of received packets, the missed packets and the PER.
The "RESTART" button allows to reset the concentrator and goes back to Region selection page.
2.3.2. Serial log panel :
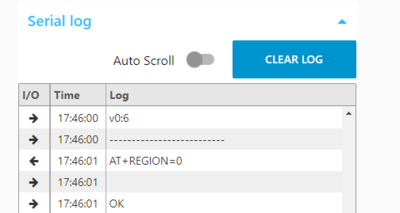
The Serial port log shows the AT commands sent to the concentrator (left arrow), and the answers (right arrow). The time stamp is the local time.
When the Auto Scroll switch is on, the log scrolls down automatically to display the new lines received. The button clear Log empties the log windows.
2.3.3. Sensor panels :
The "Sensor x" panels are added when sensors are detected. The panels can be opened by clicking on the sensor list or with the blue arrows on the top right of the panels. Each Panel shows the temperature and the RSSI values in a chart and displays the voltage in a gauge.
3. Explaining the flow
The flow is 5 tabs based, with specific role for each page :
- STM32WL Demo Tool : This is the first tab and displays help information
- Serial port configuration : This flow manages the serial port. The serial port selection must be done in this flow.
- Demo main flow : This the heart of the demo. This flow manages the dynamics of the dashboard.
- Sensor panels: This flow contains all the UI elements of each sensor panels.
- AT Command : This flow handles the command parsing and errors and the serial log part.
User don't need to understand how the flows work to use the dashboard, the only node to configure are the serial in and out. But some user may want to change charts size or add elements. In this case, the flow can be modified by user.
3.1. Serial port configuration
This flow is quite simple. It features one serial node input and one output to handle connection with the concentrator.
In order to change the com port, the user must change both nodes. The serial port status node is used to detect the event related to serial port like board disconnection. The input for serial port and the events are sent to the AT Command flow.
3.2. Demo main flow
This is the complex part of the demo, but user should not need to change it. The page can be changed if user wants to build a different application or add additional features. The flow is separated in 3 main area :
3.2.1. Home Page/Region selection
This section manages the country selection fields when the application starts.
When the application is initialized, the Region picklist is set to the current Region by the "Reset region" node.
When user changes the Region picklist, the Region value is saved in flow context and the SubRegion picklist is configured with the proper values.
When user changes the SubRegion picklist, the SubRegion value is saved in flow context.
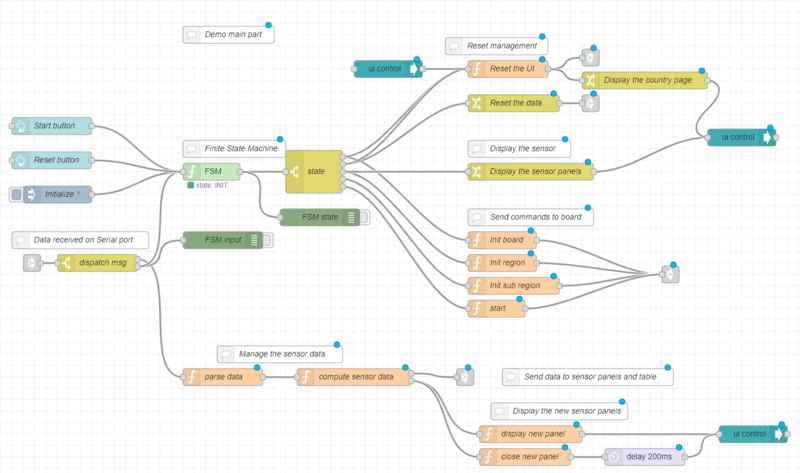
3.2.2. the Demo main part
The central section manages the dynamic of the dashboard.
The central part is the FSM nodes which implements the finite state machine. The states are :
- "INIT" : The concentrator is not connected or not yet initialized. A reset command is sent in this state
- "IDLE": The concentrator has answered to reset command, and is ready to start. The country selection page is displayed
- "SEND_REGION": The user has pressed the start button, the set region command is sent to the board, and application waits the answer
- "SEND_SUBREGION": The concentrator has answered to the set region command, the sub region command is sent
- "STARTING": The concentrator has acknowledged the sub region, application sends the start command
- "STARTED": The concentrator is started, beacons are sent periodically, and sensor status will be collected.
The FSM reacts to inputs signals :
- Start button : messages with topic "start" will start the demo (in IDLE state)
- Reset button : the demo will go to INIT state and data will be initialized when a message with topic "reset" is received
- Input from AT command flow. The input are parsed in AT Command flow, and have the following topics : "resetok" when device has performed reset, "connect" when board is connected, "disconnect" when board is disconnected, "ok" when AT command is successful, "error" when an error occurs. This inputs goes through a switch node to separate the data from sensor and the commands status.
On the right side, there are some function nodes used to set data and manage display. The Dashboard UI is managed with UI groups, which are visible or hidden when required. The 2 nodes "Display the country page" and "Display the sensor panels" are generating configuration message to hide and display the correct UI group for each state. The "Reset the UI" node is used to detect the first display of the dashboard, and configures properly the UI elements. The "Reset the data" node will clear the list of sensor, and format a "reset" message to clear all the charts in sensor panels and the Main sensor table.
Four nodes are used to send the command to the concentrator. The message is created with the AT command, and the Flow name. The flow name can be used to route answers if more than one flow are sending AT commands.
3.2.3. The sensor data management
The data coming from sensors are first decoded by the "parse data" node. The data are coming in a string and are split in an object with fields. Then, the "compute sensor data" will check the data with previous data received to check if packet have been missed, compute the PER and the statistics. The result is stored in memory and sent in a new message to update the charts and the Sensor table. The node will also detect that a new sensor appears, and will send a message in the second output to display and close the new sensor panel.
3.2.4. The sensor list management
The sensor list is displayed with the "Sensor list" node. this is a standard ui_table dashboard node. In order to have good performances, and to cache the data properly, a sub flow ui-table-handler is used. The table handler holds the table configuration (column list, colors, sizes). The ui-table handler is a subflow shared by Christian-Me in node-RED forums. announce-remote-device-table-and-collaboration-wanted. Incoming data from sensor are going to the "Inject data" node and are formatted for the ui-table handler. The "reset table" node will build a message to clear the content of the table. The "reset counters" will parse the sensor data and reset the number of packets and stats of all sensors. The "Display charts" node will send a message to "open" the sensor panel when the sensor is clicked in the table.
3.3. Sensor panels
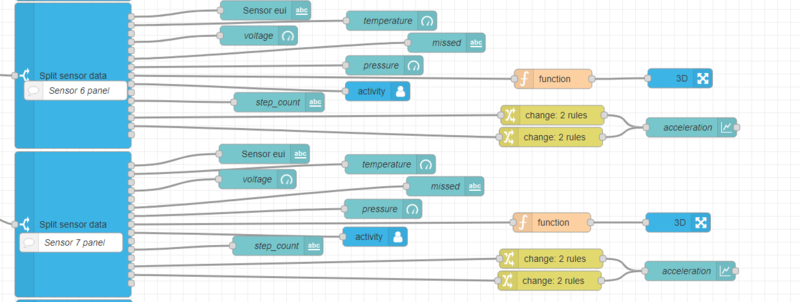
The sensor tab groups all sensor panels. For each sensor, there is a sub-flow and the ui graphic components (graph and gauge). The pattern is repeated 14 times.
For each sensor there is :
- One subflow to filter data. Each time sensor data are received, data are sent to all sensors panels. The "Split sensor data" filter the sensor number and then dispatch the data on various outputs :
- EUI : used to display the EUI in each sensor panel
- Temperature : connected to a chart in the sensor panel
- PER : (not used by default)
- Voltage : connected to a gauge in the sensor panel
- RSSI : (not used)
- Missed packet : connected to a chart in the sensor panels.
To change the sensor Id, double click on the "SplitSensorData" node and set the value in the "sensor" field. Other output can be selected by editing the sub-flow template.
- Some graphical elements to display the data : The gauge, text, chart must be in the panel UI group. ie "[SM32WL Demo] Sensor 6". The group name must not be changed because it is used to show/open the group when sensor data are received.
3.4. AT Command
The AT command tab is in charge of handling AT command logic and performing the log.
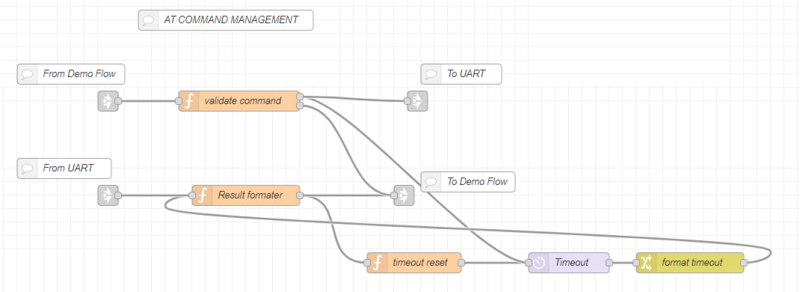
The AT commands are sent by main flow and enters in the "validate command" node. The validate command performs this tasks :
- Check that another command is not ongoing. If there is another command, send an error "Busy".
- Store the command to be processed and the origin of the message (the Flow name is indicated in message)
- Forward the command to serial port.
When the command is sent to Serial port, it is also sent to timer node to create a timeout. If there is no answer after the timeout, an error will be raised.
When the response from board is received, it is processed by "result formatter" node. It will change the message to make it understandable by other nodes (FSM, data decoding, timeout node). The node also handles the connect, disconnect and reset messages.
The "timeout reset" checks the answer type, and if it is the end of a command, the timeout timer will be stopped.
When Timeout timer ends, then a message is sent to "Result formatter" to cancel ongoing AT command and raise a timeout error to the main flow.
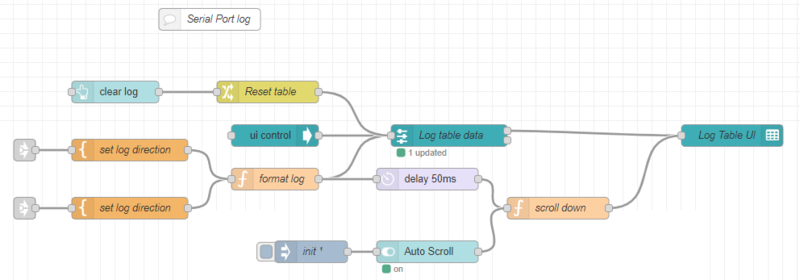
The bottom part of the tab manages the log area.
The logs are coming from the serial port or from the flow output. A direction information is added in the "from" field of each message. Then, the log are formatted : time stamp is added, and object is created with the timestamp, direction and log information. The data are then sent to ui-table handler and displayed in ui-table. The scroll down function node has 2 goals :
- store auto scroll status when it is changed
- If auto-scroll is on, each time a new message is added in log, send a request to ui-table to scroll to the last line of log.
4. AT commands details
The AT commands listed below are used for the demo dashboard
4.1. Concentrator reset and config :
- ATZ : Resets the board.
- AT+REGION=x : Defines the region.
- AT+SUBREGION=x : Defines the subregion.
- AT+BEACON_ON : Starts the beacon broadcast.
- AT+LIST_REGIONS : Prints list of all available regions and subregions.
4.2. sensor status :
The concentrator sends the data received from sensors in notifications : AT+RCV. Exemple : AT+RCV=0x00004e1c,0x10,0:6,-35,6,+30.00,3.30 Format of the message is :
- AT+RCV=
- 0x00004e1c : Sensor EUI
- 0x10 : number of packet transmitted by the sensor.
- -35 : RSSI level
- 6 : SNR
- +30.00 : sensor temperature (inside MCU)
- 3.30 : sensor voltage
