This article describes how to create, build and debug a Linux® user space application for STM32 MPU, using the standard Eclipse® CDT™ wizard.
1. Prerequisites[edit | edit source]
You should have followed instructions given in this article How to develop an OpenSTLinux user space application with STM32CubeIDE before jumping in the current one.
2. Create a "user space" project[edit | edit source]
- Open the new C project wizard: File -> New -> Project... C Project.
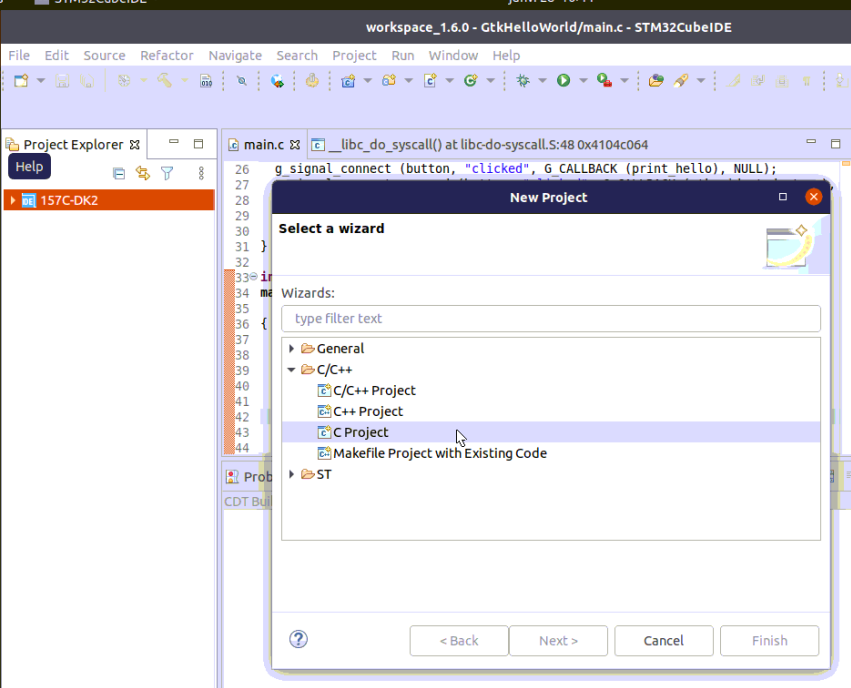
- In the first window, choose OpenSTLinux SDK
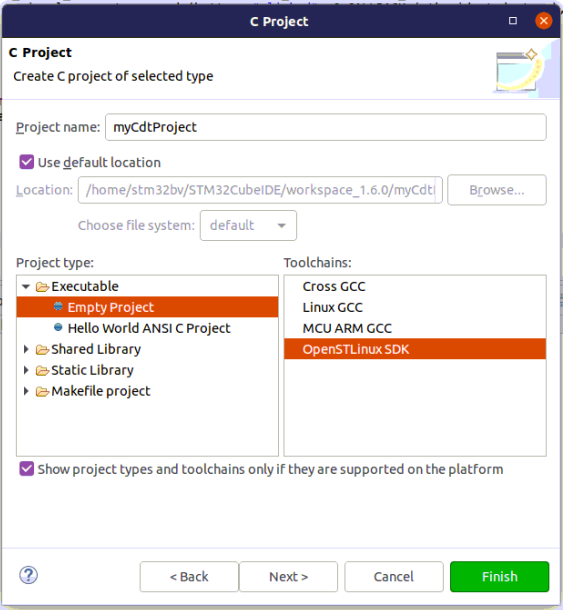
- Then Next to set up configuration
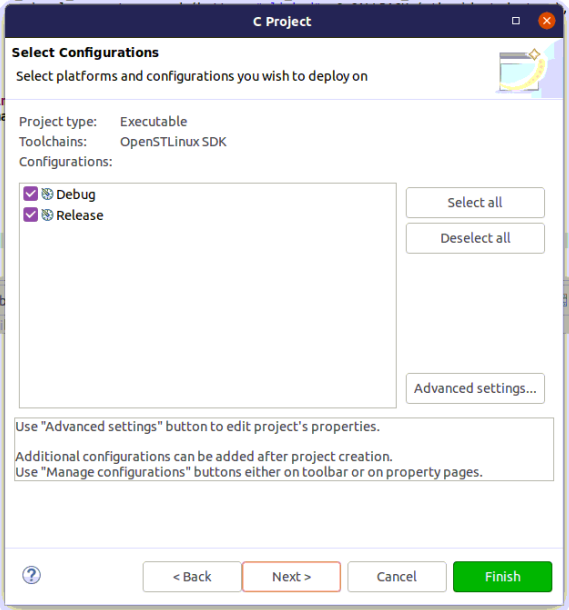
- and Next to choose the SDK version
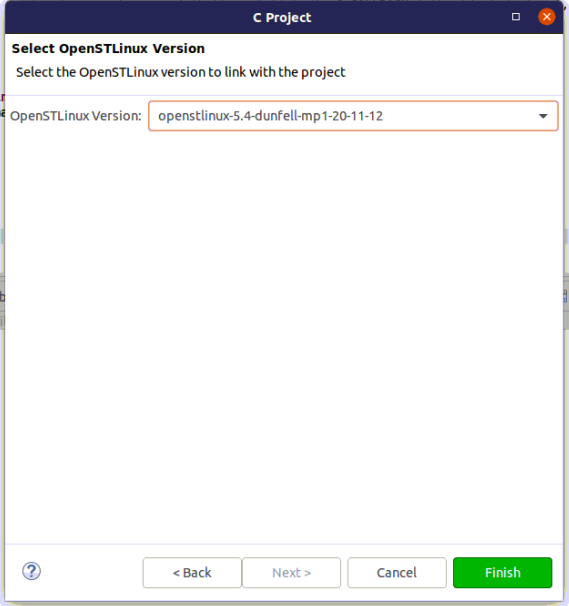
- To populate this project with file "main.c", first select project, then right-click New -> File -> main.c, and then fill it with some C code.
3. Build[edit | edit source]
- Select your project, right-click and then Build Project.
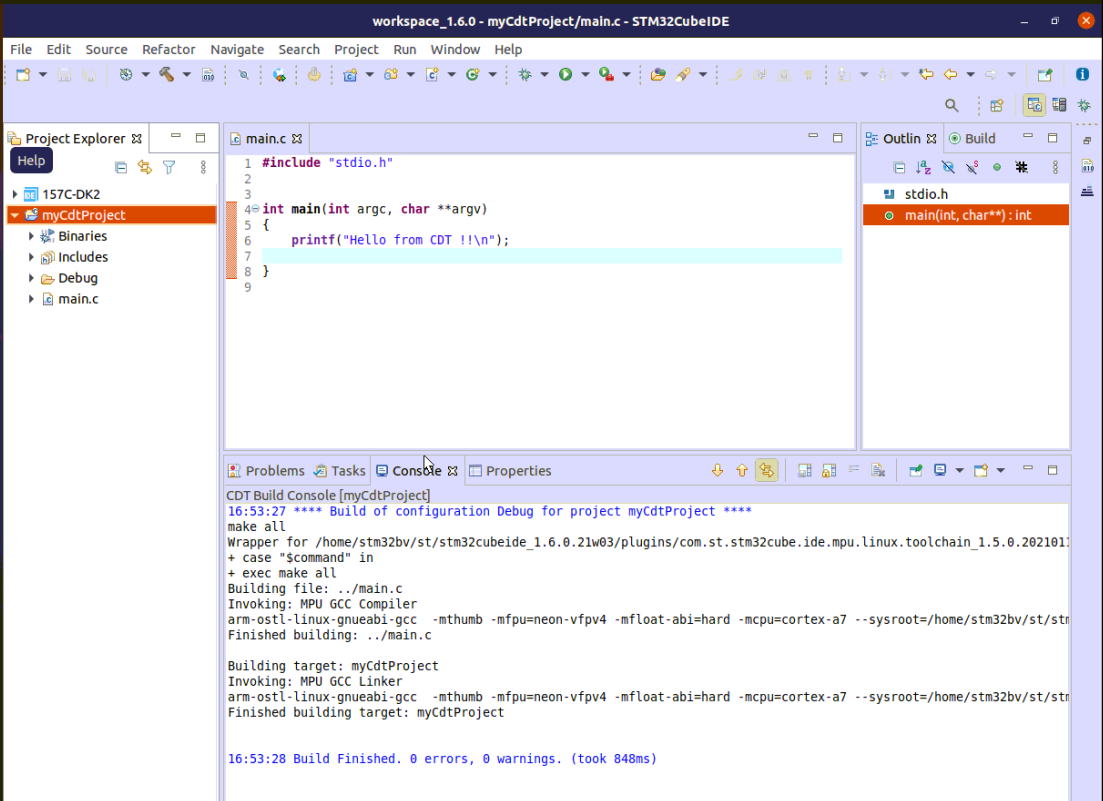
4. Prepare Debug Configuration[edit | edit source]
You can check boot messages via Linux® console opened with butterfly icon (shown below), but remember this console cannot be shared outside STM32CubeIDE (minicom,...).
In order to debug user space application, your target must be Linux® booted and network connected.
To check network connection, start the Target Status widget in the bottom right corner of the window.

Check How to set up proxy and P2P Ethernet connection with STM32CubeIDE if you have some proxy problem.
5. Set Debug Configuration[edit | edit source]
- Select your project, right-click Debug as... > Debug Configurations.
- Then create an STM32 Cortex-A Remote Application debug configuration, and double-click on it.
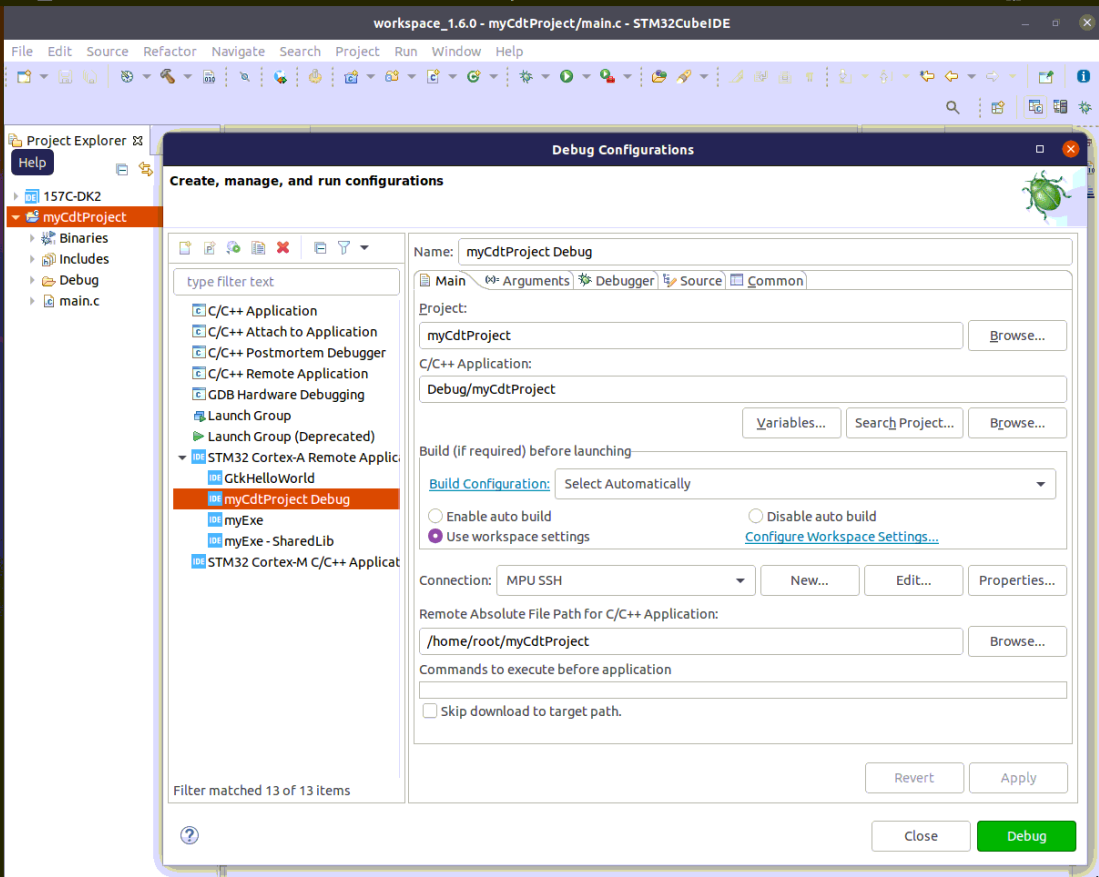
64-bit SDK set-up

6. Debug[edit | edit source]
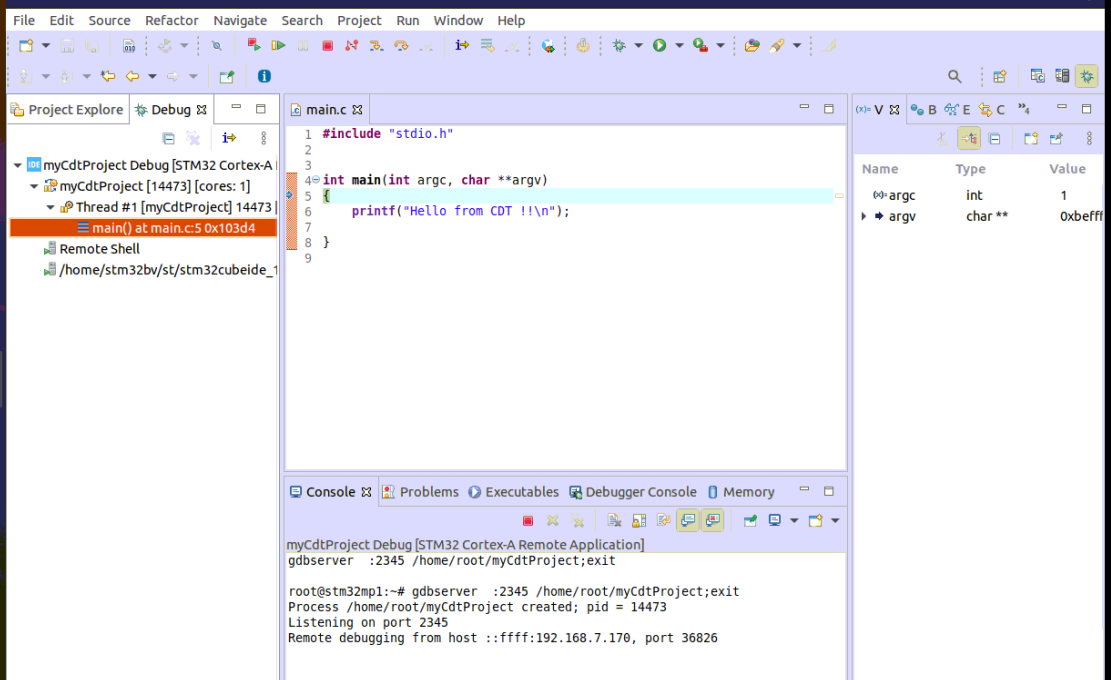
Click on Debug:
- Executable is downloaded to the target,
- GDBServer is launched on the target,
- GDBClient is launched on the workstation and can exchange via network with GDBServer.
| In case of error; check if GDBServer is still running on the target. |