This message will disappear after all relevant tasks have been resolved.
Semantic MediaWiki
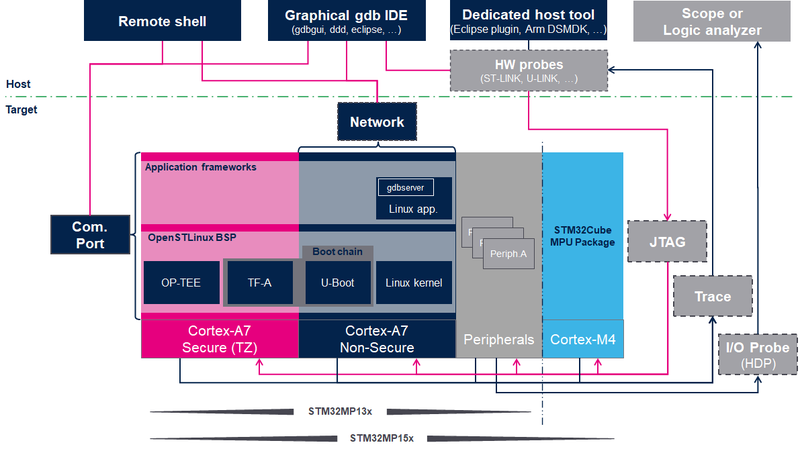
There are 1 incomplete or pending task to finish installation of Semantic MediaWiki. An administrator or user with sufficient rights can complete it. This should be done before adding new data to avoid inconsistencies.The block diagram below shows the STM32MP1 Platform trace and debug environment components and their possible interfaces:
- The STM32MPU Embedded Software package (see STM32MPU Embedded Software architecture overview) that includes:
- The OpenSTLinux BSP and application frameworks components, running on the Arm® Cortex®-A core
- The STM32Cube MPU Package, on STM32MP15x lines
 only, running on the Arm® Cortex®-M core
- The STM32MPU peripherals shared between Cortex®-A (on STM32MP1 series) and Cortex®-M (on STM32MP15x lines only) cores (such as GPIO, I2C and SPI)
- The user interfaces or tools, which allow to interact with different trace and debug Tools, such as:
- The remote shell using terminal console
- The debugger tools (such as GDB)
- The graphical IDE (such as GDBGUI or SystemWorkbench)
- The trace and debug interfaces or hardware paths that provide access to trace and debug components through:
- The network interface (e.g. Ethernet)
- The communication port (e.g UART)
- The hardware connector interfaces:
- JTag port
- Trace port to access ETM, STM, ITM and SWD
- I/O probes to access HDP
- The hardware probes such as ST-Link.
This block diagram also illustrates the Arm® debugging modes:
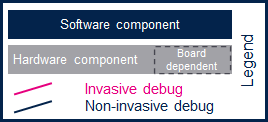
- Invasive debug: debug process that allows the control and monitoring of the processor. Most debug features are considered invasive because they enable you to halt the processor and modify its state.
- Non-invasive debug: debug process that allows the monitoring of the processor but not the control. The embedded trace macrocell (ETM) interface and the performance monitor registers are non-invasive debug features.
Click the figure below to directly jump to the component you want to trace, monitor or debug:
- By selecting a hardware component, you will be redirected to the corresponding hardware board article in order to check if the hardware connector is supported on your board.
- By selecting a target software component, you will be be redirected to an article that explains in details how to trace, monitor or debug this component.
- By selecting a host software component, you will be redirected to an article that explains how to use this remote tool.
Arm® is a registered trademark of Arm Limited (or its subsidiaries) in the US and/or elsewhere. ![]()
Arm® is a registered trademark of Arm Limited (or its subsidiaries) in the US and/or elsewhere. ![]()