Exceptionally, this wiki is under maintenance.
You can continue to browse it to discover the STM32MP1 series and associated ecosystems (STM32 boards, embedded software, development tools, trace & debug tools...) but contributors can not improve their favorite articles, during phase.
Thank you for your understanding.
- Last edited 2 years ago ago
How to debug with Serial Wire Viewer tracing on STM32MP15
This article does not intend to cover all STM32CubeIDE Serial Wire Viewer (SWV) capabilities; complete information is available in (UM2609), chapter 4. It only provides some setup information for STM32MP15 serie, debugging Cortex-M in Production Mode.
In that mode, the available console on the board (UART4) is used by Cortex-A Linux. The clock tree is managed by Linux and 'Trace clock' needed to setup SWO is available from Linux console with command:
awk '/ck_trace/{print $5}' /sys/kernel/debug/clk/clk_summary
In order to test, let's modify main.c file from a generated project with a looping variable 'i', as depicted hereafter.
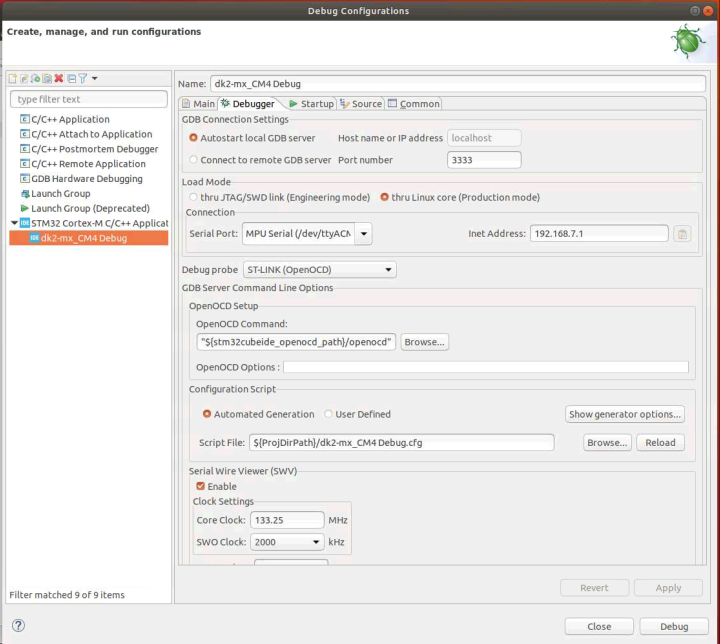
Then, setup debug configuration, enabling SWV and setting the clock: 133.25MHz here.
Stopping Debug session, open Serial Wire Views: Window > Show View > Other... > SWV > SWV Trace Log & SWV Data Trace.
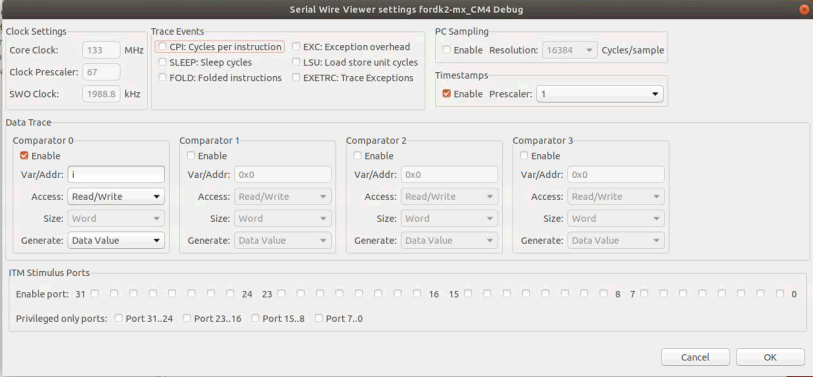
In SWV Trace Log > Configure Trace menu, setup Comparator 0 in order to spy variable 'i'.
Then start the trace
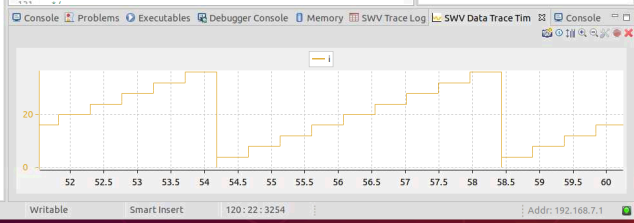
Resuming debug session gives inside SWV Data Trace view the corresponding graphic.


